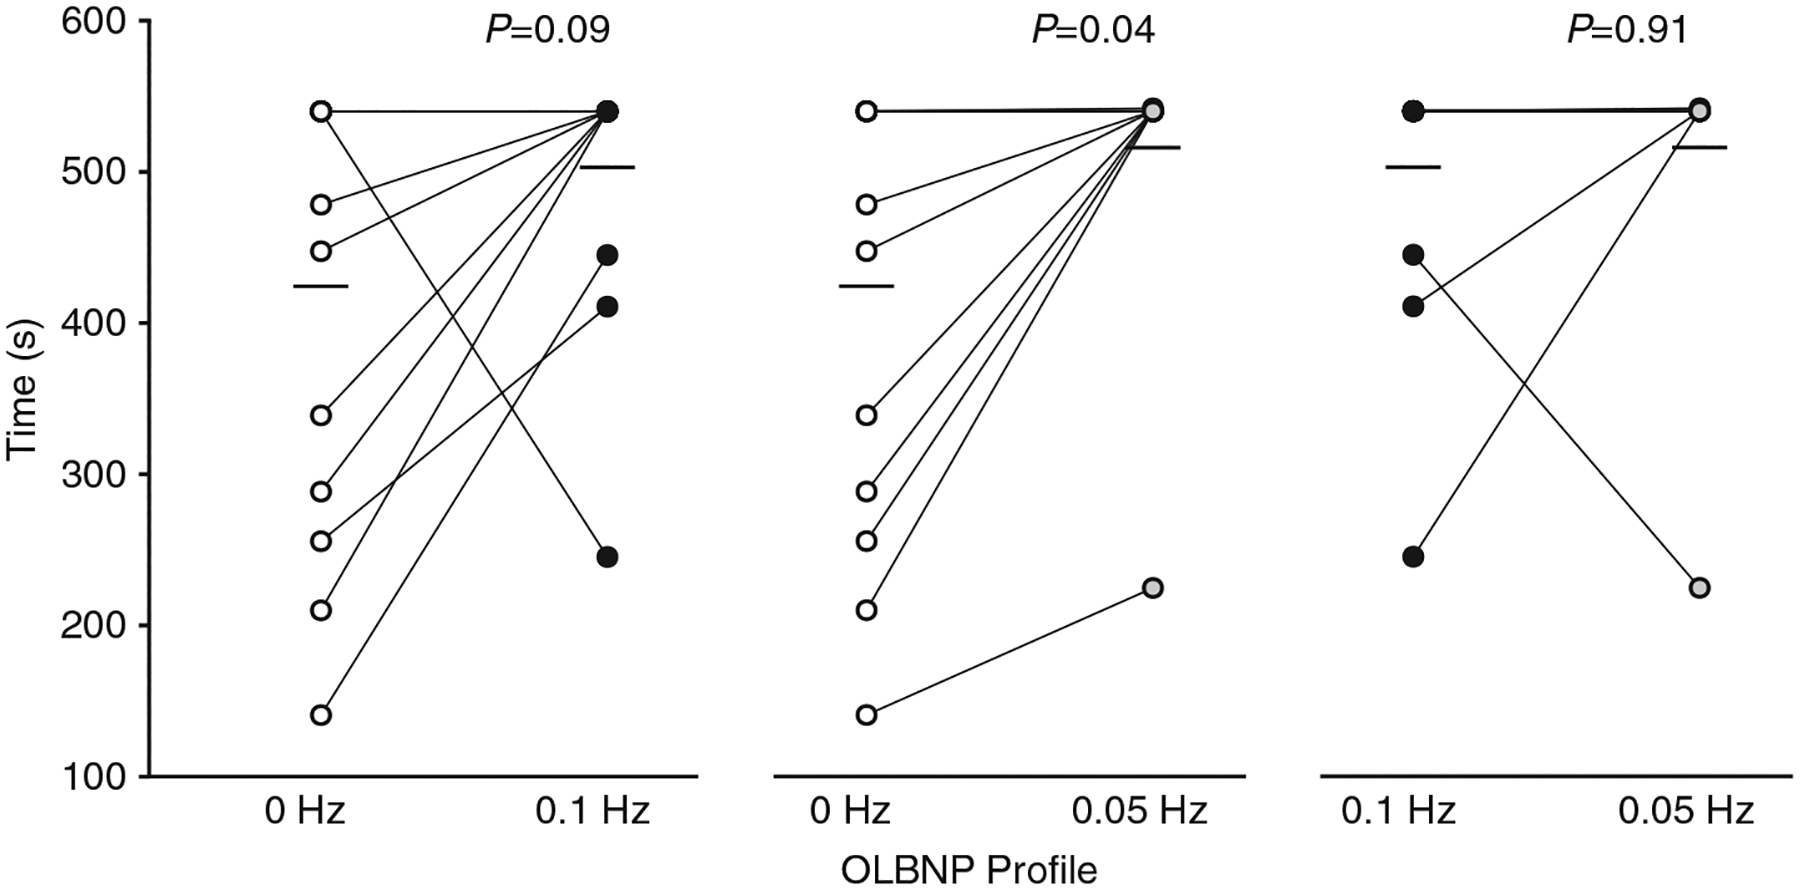
FIGURE 2.

Tolerance to each oscillatory lower-body negative pressure (OLBNP) profile (time). Individual subject responses (circles) and mean responses (filled bars) are presented. Open circles, 0 Hz; black circles, 0.1 Hz; and grey circles, 0.05 Hz. Tolerance was higher for both the 0.1 and 0.05 Hz oscillatory profiles compared with the static 0 Hz profile. Data were analysed with a linear mixed model for repeated measures followed by Tukey’s post hoc tests. Owing to the 540 s cut-off for each of the profiles, subject data points may overlap. The number of subjects in each profile are as follows: 0 Hz profile, n = 14; 0.1 Hz profile, n = 14; and 0.05 Hz profile, n = 13
