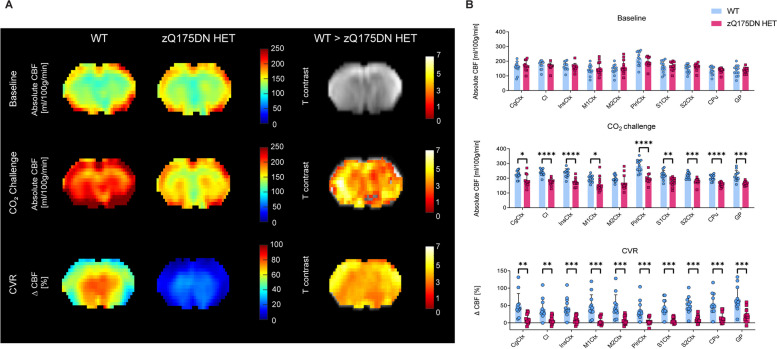
Fig. 4.
Altered hypercapnic CBF and CVR in zQ175DN HET mice at 15 months of age. (A) Mean midbrain absolute CBF maps under baseline, under CO2 Challenge and CVR in both WT and zQ175DN HET group and a statistical T-map from VBA for each condition, overlaid on the study-specific template, showing local genotypic differences (Two-sample T-test, p < 0.05, FDR corrected, k ≥ 10); (B) RBA in predefined cortical and subcortical regions under baseline, CO2 Challenge and CVR, represented with subject values of absolute CBF and a group mean ± SD (multiple two-sample T-test, p < 0.05, FDR corrected); Significant difference after FDR correction * p ≤ 0.05, ** p ≤ 0.01, *** p ≤ 0.001, **** p ≤ 0.0001; CgCtx—Cingulate Cortex, Cl – Claustrum, InsCtx – Insular Cortex, M1/2Ctx – Motor Cortex 1/2, S1/2Ctx – Somatosensory Cortex 1/2, CPu – Caudate Putamen, GP – Globus Pallidus

