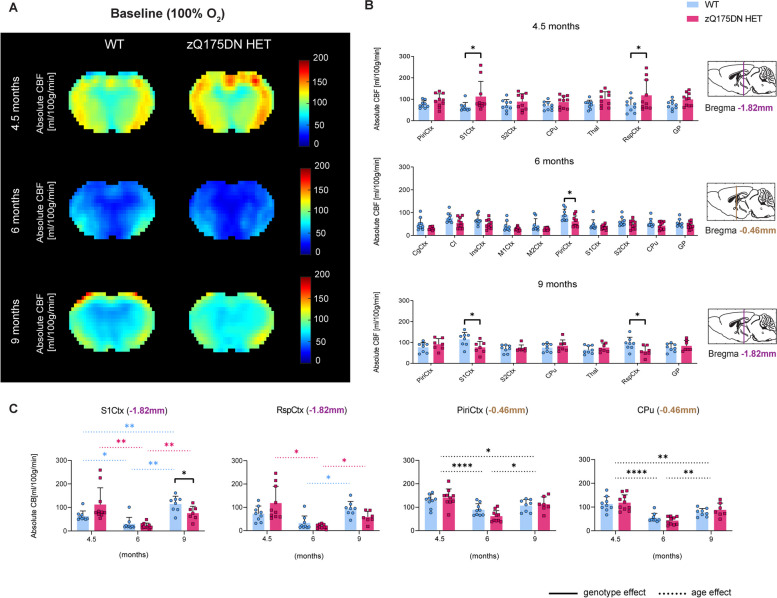
Fig. 5.
CBF alterations under baseline (100% O2) conditions in the zQ175DN HET mice. (A) Mean midbrain absolute CBF maps in both WT and zQ175DN HET group at 4.5, 6 and 9 months of age; (B) RBA in predefined cortical and subcortical regions at 4.5, 6 and 9 months at different Bregma levels, represented with subject values of absolute CBF and a group mean ± SD (multiple two-sample T-test, p < 0.05, FDR corrected); (C) Longitudinal assessment of absolute CBF genotypic changes in four regions (mixed effect model, p < 0.05); Dashed colored lines represent the overall age effect within WT (blue) and zQ175DN HET (red). Significant difference after FDR correction * p ≤ 0.05, ** p ≤ 0.01, *** p ≤ 0.001, **** p ≤ 0.0001; CgCtx—Cingulate Cortex, RspCtx – Retrosplenial Cortex, Cl – Claustrum, InsCtx – Insular Cortex, Piri – Piriform Cortex, M1/2Ctx – Motor Cortex 1/2, S1/2Ctx – Somatosensory Cortex 1/2, CPu – Caudate Putamen, GP – Globus Pallidus, Thal—Thalamus

