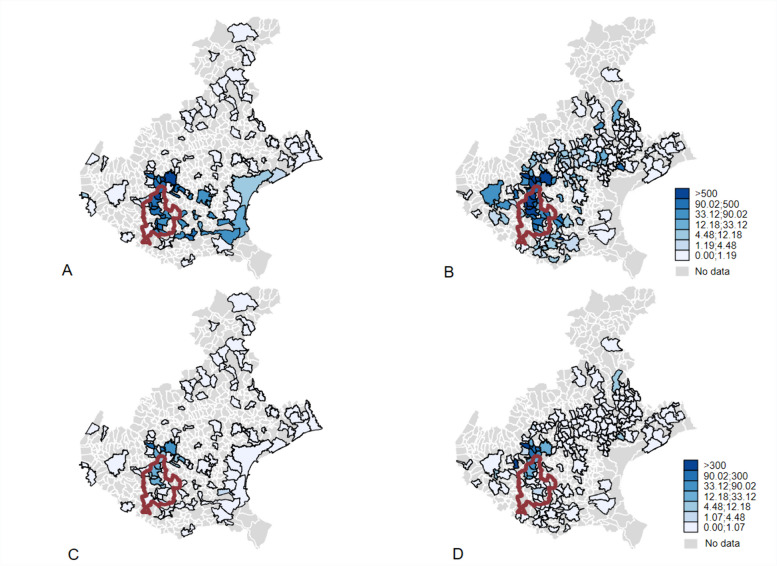
Fig. 1.
Map of concentrations (ng/L) of perfluorooctanoic acid (PFOA) (top panels A and B) and perfluorooctanesulfonic acid (PFOS) (bottom panels C and D) in the surface water (left panels A and C) and groundwater (right panels B and D) of the municipalities of the Veneto Region (northern Italy). A red outline indicates the Red area. July 2013–June 2015. Source: Environmental Prevention and Protection Agency of the Veneto Region (ARPAV) (https://www.arpa.veneto.it/dati-ambientali/open-data/idrosfera/concentrazione-di-sostanze-perfluoroalchiliche-pfas-nelle-acque-prelevate-da-arpav. Accessed 14 Feb 2024)

