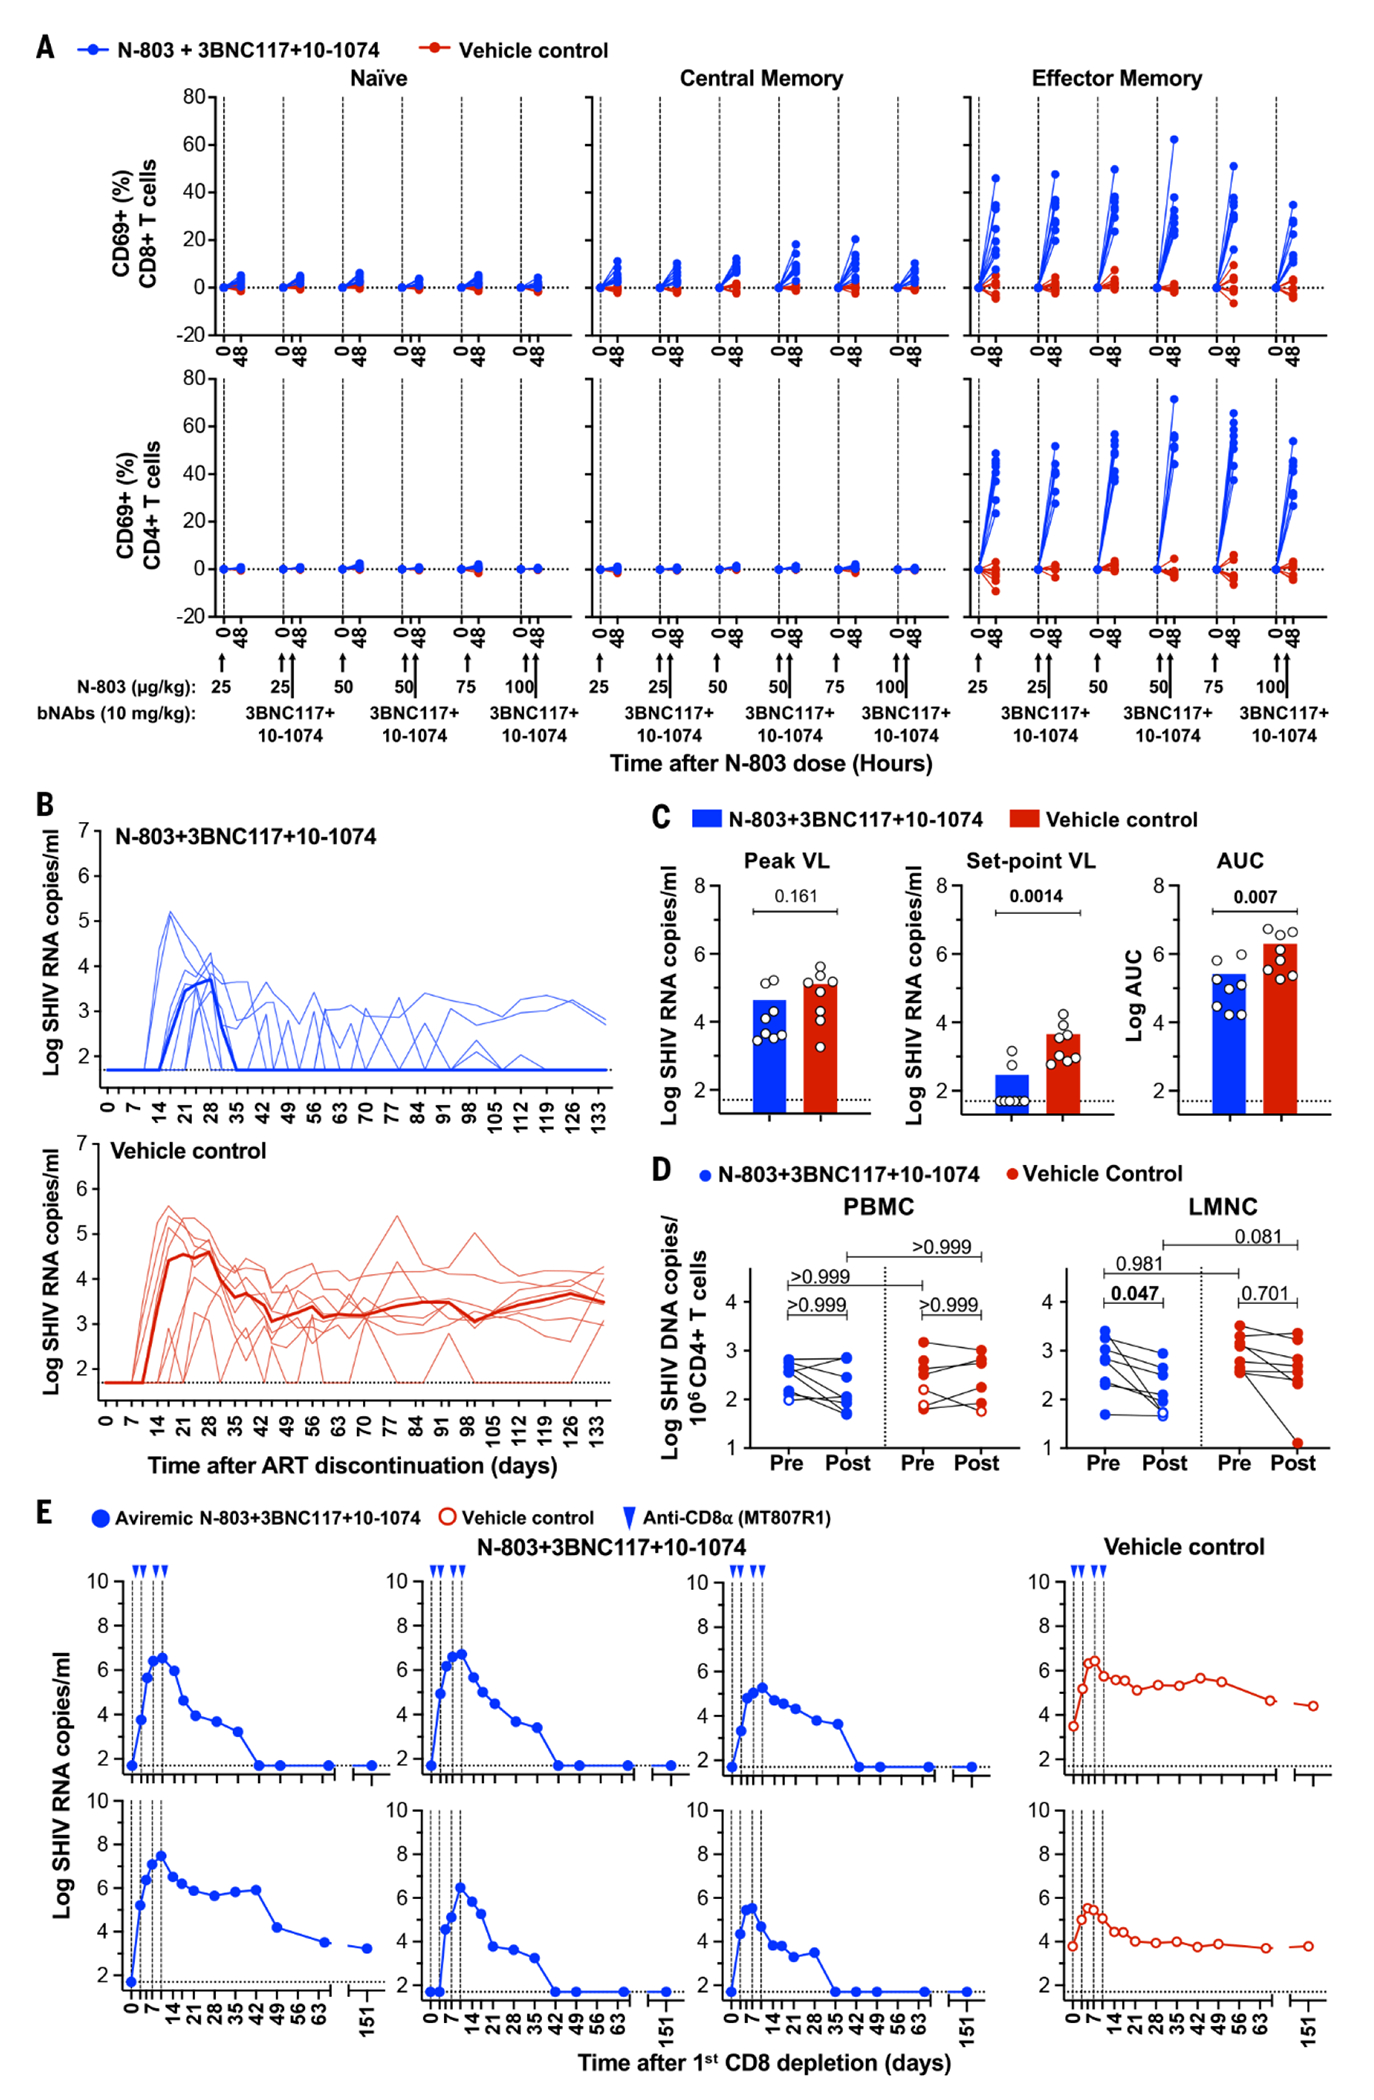
Fig. 3. Viral and immune modulation following ART discontinuation and CD8+ lymphocyte depletion.

The activation of T cells following N-803+10-1074 administration: Activation of naïve (CD95−CD28+), central memory (CD95+CD28+), and effector memory (CD95+CD28−) populations from CD8+ and CD4+ T cells was monitored by flow cytometry–based measurement of CD69. (A) CD69 expression within each subset was measured at the time of each dose (baseline) at 48 hours post each N-803 dose. Changes in CD69 expression are shown as the absolute difference in percent from the day of dose for all immune subsets. N-803 and 10-1074 dosing are indicated by black arrows on the x-axis. (B) Viral rebound following ART discontinuation after bNAb washout. Median values are indicated as bold lines. (C) Viral RNA levels at the time of peak, set point and AUC are shown. Statistical comparisons between groups were assessed using a Mann–Whitney U test. (D) Intact SHIV DNA in CD4+ T cells prior to and after treatment with N-803+bNAbs. Intact SHIV DNA by IPDA is expressed as log10 copies per sorted 106 CD4+ T cells. The results are shown as the mean of intact SHIV genomes per 106 CD4+ T cells calculated from three replicates, corrected for 2LTR circles and DNA shearing (filled symbols). Open symbols represent the limit of detection for samples in which no positive events were detected across three replicates, based on the number of cell equivalents assayed. Differences in intact viral DNA between groups at the time of pre- and post-treatment were compared using a Kruskal–Wallis H test and intact DNA at post-treatment were compared to pre-treatment using a Wilcoxon matched-pairs signed-rank test. P-values were adjusted for multiple comparison by Dunn’s test. (E) In vivo CD8+ lymphocyte depletion. CD8+ lymphocytes were depleted in vivo using monoclonal antibody MT807R1 in two control animals and all six treated remission RMs. The presence of CD8α+ lymphocytes in the blood was monitored by flow cytometry. Log viral RNA was assessed at the intervals indicated.
