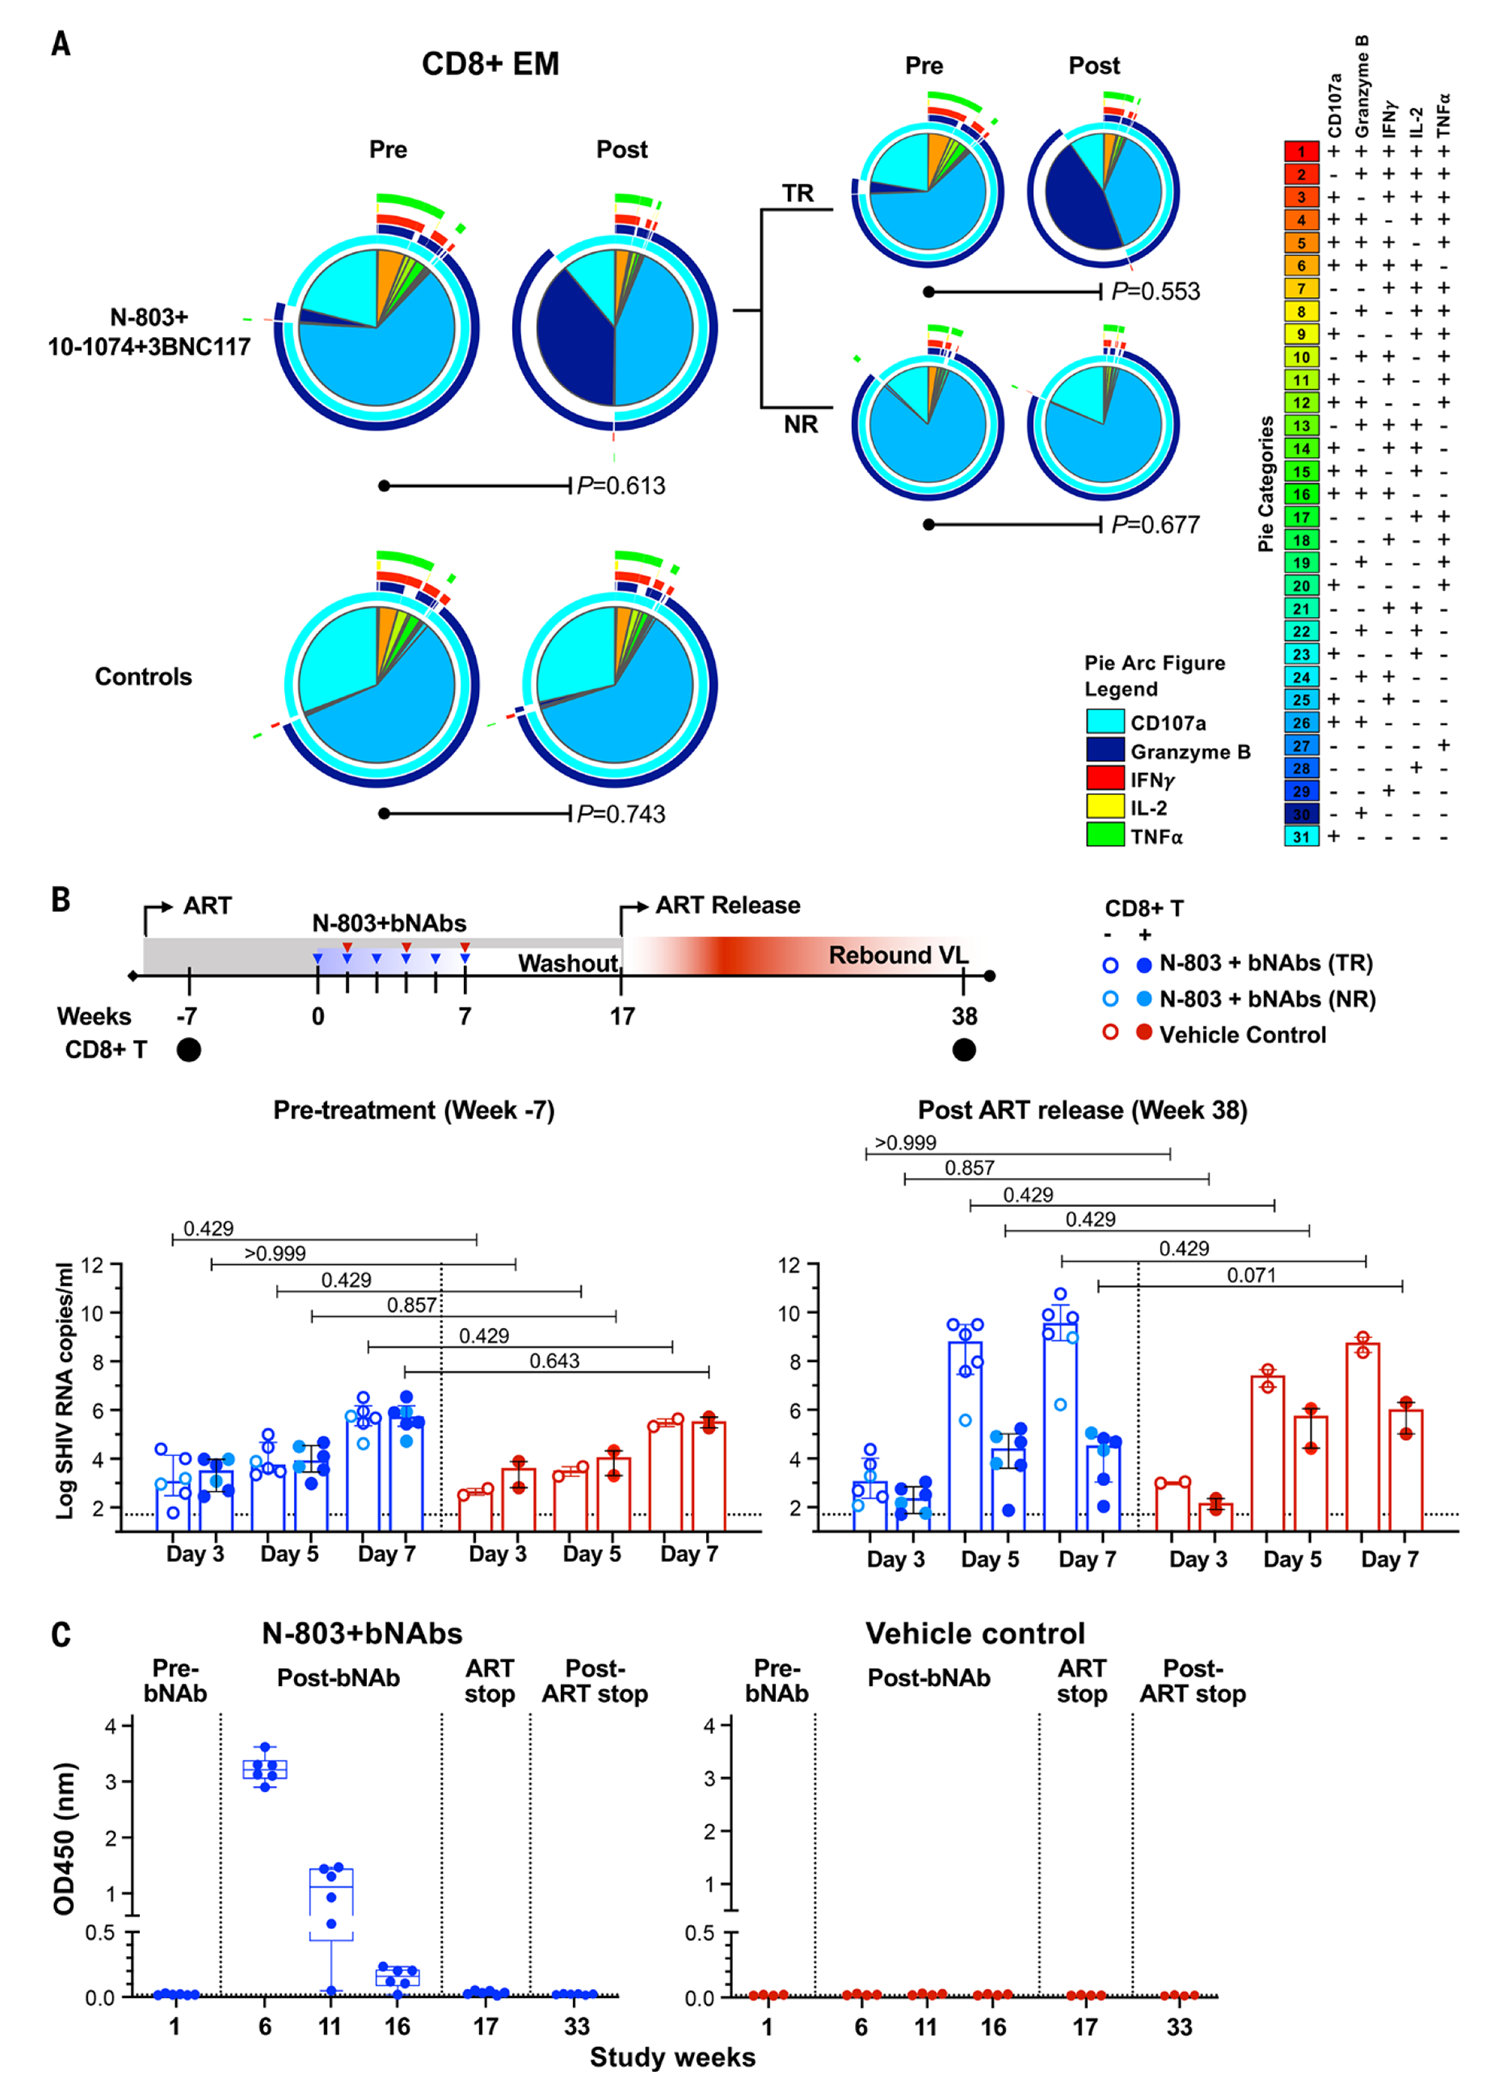
Fig. 4. Modified CD8+ T cell effector function and bNAb-antigen binding.

(A) Polyfunctional CD8+ T cell responses to SIVmac239 Gag peptides were measured by intracellular cytokine staining for CD107a, granzyme B, IFNγ, IL-2, and TNFα. The pie charts show the mean frequency of cells with different combinations of effector functions. Eight animals in N-803 treated group were then divided into treated-responder (TR, n=6) and treated non-responder (NR, n=2). P-values were computed using a permutation test described in Materials and Methods. (B) Ex vivo SHIV suppression assay to evaluate virus specific CD8+ T cell responses. Shown are viral replication in CD4+ T cells cultured alone or in the presence of autologous CD8+ T cells isolated from N-803+bNAb-treated animals that remained viremic or became viremic and control group. CD8+ T cells were isolated prior to treatment (Week −7) and 149 days after ART release. SHIV RNA copies in culture supernatant between CD4+ alone or with CD8+ T cells was measured by real-time PCR on days 3, 5, and 7 post culture. Statistical significance in differences in SHIV RNA with or without CD8+T cells was determined using a Kruskal–Wallis H test with Dunn’s post-test for multiple comparison. (C) Binding antibodies to BG505 SOSIP.664-His-gp140 protein were evaluated using samples isolated from treated (n=6) and control (n=4) RMs at pre-treatment (24 hours before the first bNAb dose), after bNAbs infusions (1, 5, and 11 weeks after the third N803 dose), ART discontinuation, and 16 weeks after ART discontinuation. Antibodies to BG505 SOSIP.664 trimer (1:100 diluted) at each representative time point are shown. The lower limit of detection is indicated as a hatched line. Box-and-whisker plot with all data points are shown. The binding of two bNAbs used in the study, 3BNC117 and 10-1074 to BG505 SOSIP.664-His-gp140 was tested. The average values and standard deviation of the mean from three separate experiments are shown.
