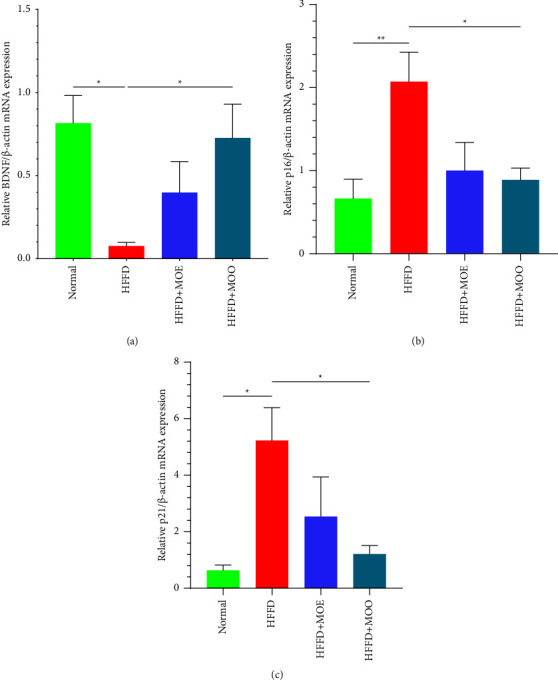
Figure 3.

(a) Quantitative band analysis of relative BDNF/β-actin mRNA expression; (b) quantitative band analysis of relative p16/β-actin mRNA expression; (c) quantitative band analysis of relative p21/β-actin mRNA expression. All data are displayed as mean ± SEM. The T-shaped lines on the bars represent the standard error. Results that not sharing the same letters in the same graphic are significantly different by ANOVA followed by a Tukey's test (p ≤ 0.05). Normal = normal diet, HFFD = high-fat, high-fructose diet, MOE = aqueous leaves extract of Moringa oleifera, MOO = Moringa oleifera seed oil. ∗p < 0.05; ∗∗p < 0.01.
