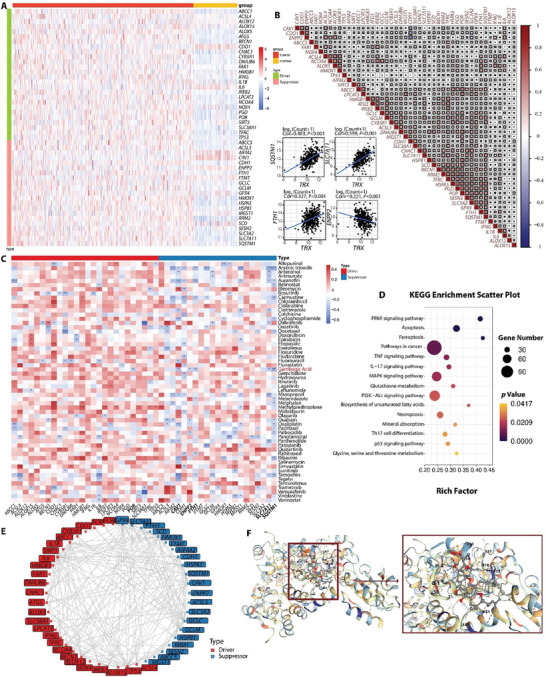
Figure 2.

A) The heat map of differentially expressed ferroptosis regulator genes in TNBC and normal breast tissues. B) Diagrams of the correlations between the expression levels of ferroptosis regulators. The scatter plot represented the correlation between TXN (or TRX) and SQSTM1, SLC7A11, FTH1, and ENPP2. (C) Correlation between IC50 values of 57 predicted ferroptosis inducers and the expression levels of ferroptosis suppressors and drivers. *P < 0.05, **P < 0.01, and ***P < 0.001. D) The KEGG enrichment analysis of gene expressions in gambogic acid (GA)‐treated 4T1 cells compared with that in PBS‐treated 4T1 cells. (E) Protein‐protein interaction (PPI) network of ferroptosis regulator genes. F) Structures of the TRX and GA combination predicted with molecular docking.
