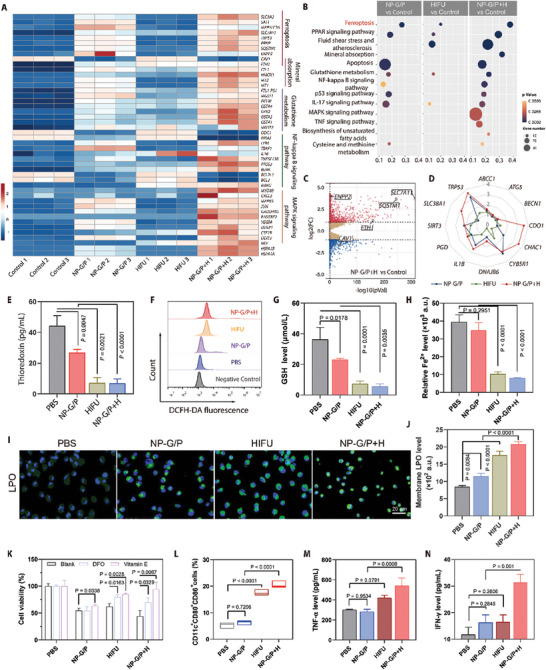
Figure 4.

A) The heat map of typical differentially expressed genes in 4T1 cells after different treatments through the RNA‐sequencing analysis (n = 3). The number in the scale plate referred to the |log2fold change|. B) The top 13 pathways in which differentially expressed genes in 4T1 cells were enriched by the KEGG enrichment analysis. C) The volcano map showed the identified upregulated and downregulated genes induced by NP‐G/P treatment compared with PBS treatment (n = 3). The screening criteria were FDR < 0.05 and |log2fold change|> = 1. D) The radar chart of typical differentially expressed ferroptosis‐driver genes in 4T1 cells after different treatments through the RNA‐sequencing analysis (n = 3). The number in the radar chart referred to the |log2fold change|. E) The intracellular thioredoxin expression in 4T1 cells after different treatments (n = 3). F) Relative ROS levels in 4T1 cells after various treatments after staining with DCFH‐DA. G) Quantitative analysis of intracellular GSH concentration in 4T1 cells after various treatments (n = 3). H) The relative expression level of ferric (II) in 4T1 cells after various treatments (n = 3). I) Fluorescence imaging of 4T1 cells with various treatments after staining with BODIPY‐C11, showing the intracellular distribution of LPO (green fluorescence). J) The intracellular LPO level in 4T1 cells after various treatments was measured by flow cytometry (n = 3). K) The cell viability of 4T1 cells that received different treatments in the presence of different ferroptosis inhibitors including DFO and vitamin E (n = 3). L) Flow cytometry analysis of CD80+CD86+ BMDC cells in different groups (n = 3). M,N) The expression levels of TNF‐α (M) and IFN‐γ (N) secreted from BMDCs co‐incubating with 4T1 cells after various treatments (n = 3). In all cases, significance was defined as P ≤ 0.05. The significance of the difference between two groups was determined via Student's t‐test. The significance of the difference of more than two groups was determined via One‐way ANOVA test.
