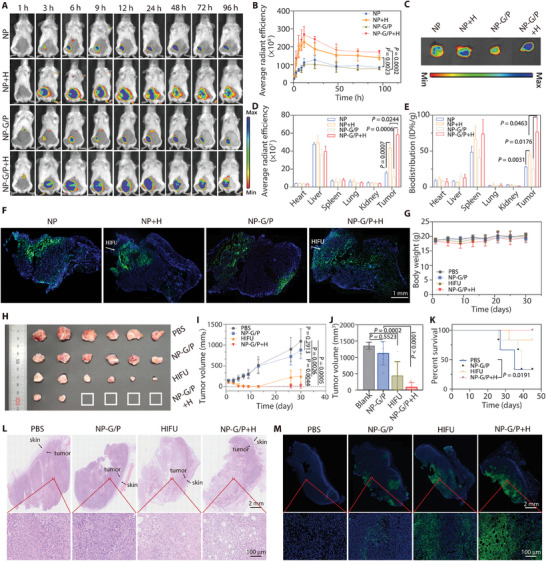
Figure 5.

A) Representative in vivo fluorescence images of 4T1 tumor‐bearing mice after intravenous injection of NP or NP‐G/P at different time points, and HIFU treatment was performed at 3 h after NP or NP‐G/P injection. B) Fluorescence signals at tumor regions were plotted with time based on in vivo fluorescence imaging (n = 3). C) Ex vivo imaging of major organs and tumors at 24 h after injection. D) Semi‐quantitative biodistribution of nanomotors in major organs and tumors at 24 h after injection obtained from ex vivo imaging (n = 3). E) Quantitative biodistribution of nanomotors in major organs and tumors at 24 h after injection (n = 3). F) Representative immunofluorescence images of tumor slices at 12 h after injection to reveal the accumulation and penetration pattern of nanomotors in tumors. Blue: cell nuclei; Green: nanoparticles. G) Changes of the body weight of mice after various treatments within 30 days (n = 6). I) Tumor growth curves of mice after different treatments within 30 days (n = 6). H,J) Photograph images H) and the tumor volume J) of excised tumors at 30 days in various treatment groups (n = 6). K) Survival curve of 4T1 tumor‐bearing mice within 45 days (n = 6). L,M) Representative histochemical images (H&E staining) L) and cell apoptosis images (TUNEL staining) (M) of tumor slices obtained at the 7th day after various treatments. Red boxes in the upper row were shown in the lower row with high magnification. In all cases, significance was defined as P ≤ 0.05. The significance of the difference between two groups was determined via Student's t‐test. The significance of the difference of more than two groups was determined via One‐way ANOVA test.
