Figure 1.

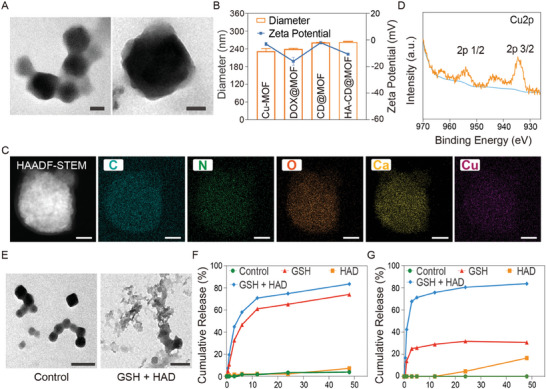
Synthesis and characterization of HA‐CD@MOF NPs. A) TEM images of HA‐CD@MOF NPs (scale bars: 50 nm). B) Diameters and zeta potentials of Cu‐MOF NPs, DOX@MOF NPs, CD@MOF NPs, and HA‐CD@MOF NPs; n = 3 . C) High‐angle annular dark field‐scanning transmission electron microscopy (HAADF‐STEM) image and elemental mapping of HA‐CD@MOF NPs (scale bars: 100 nm). D) Cu 2p X‐ray photoelectron spectroscopy (XPS) spectrum of HA‐CD@MOF NPs. E) TEM images of HA‐CD@MOF NPs with different treatments after 24 h (scale bars: 200 nm). F) Ca2+ release and G) DOX release from HA‐CD@MOF NPs under different conditions. Results are presented as means ± SD. *p < 0.05, **p < 0.01, ***p < 0.001, ****p < 0.0001.
