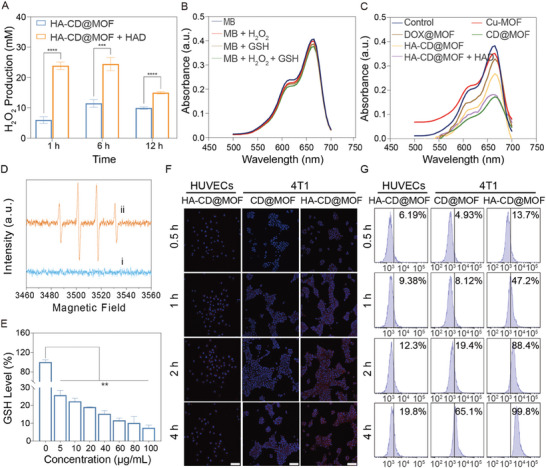
Figure 2.

CDT capacity and targeting abilities of HA‐CD@MOF NPs. A) H2O2‐generating ability of the HA‐CD@MOF NPs with or without HAD in solutions with GSH (10 mm); n = 3. B) The effect of GSH (10 mm) and H2O2 (10 mm) on MB degradation. C) MB degradation rate under different conditions in solutions with GSH (10 mm) and H2O2 (10 mm). D) Electron spin resonance spectra of DMPO mixed with HA‐CD@MOF NPs under different conditions (i, without GSH and HAD; ii, with GSH and HAD). E) The GSH‐depleting ability of HA‐CD@MOF NPs at different concentrations, n = 3. F) CLSM images of HUVECs and 4T1 cells after coincubation with CD@MOF NPs or HA‐CD@MOF NPs for various times (scale bars: 50 µm). G) FCM analysis of the intracellular uptake of CD@MOF NPs or HA‐CD@MOF NPs in 4T1 cells and HUVECs for 0.5, 1, 2, and 4 h. Results are presented as means ± SD. *p < 0.05, **p < 0.01, ***p < 0.001, ****p < 0.0001.
