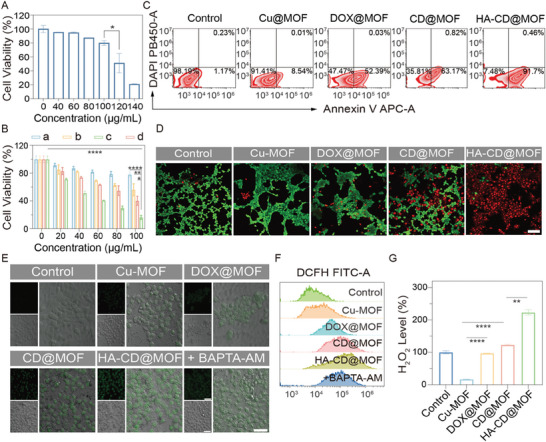
Figure 3.

Self‐reinforced chemodynamic potency of the Mito‐Jammer in the TME. A) Biosafety of HUVECs after coincubation with different concentrations of HA‐CD@MOF NPs for 12 h, n = 3. B) Cell viability of 4T1 cells after treatment with a) Cu‐MOF, b) DOX@MOF, c) CD@MOF, and d) HA‐CD@MOF NPs at different concentrations for 6 h, n = 3. C) FCM measurement of 4T1 cell apoptosis ratios in the control, Cu‐MOF, DOX@MOF, CD@MOF, and HA‐CD@MOF NP groups. D) CLSM images of 4T1 cells after live and dead staining. Red fluorescence refers to dead cells, and green fluorescence refers to live cells (scale bar: 50 µm). E) CLSM images of DCFH‐DA assays of 4T1 cells under different treatments (scale bars: 50 µm). F) Quantitative analysis of DCF fluorescence intensity within 4T1 cells measured via FCM. G) H2O2 levels within 4T1 cells under various conditions, n = 3. Results are presented as means ± SD. *p < 0.05, **p < 0.01, ***p < 0.001, ****p < 0.0001.
