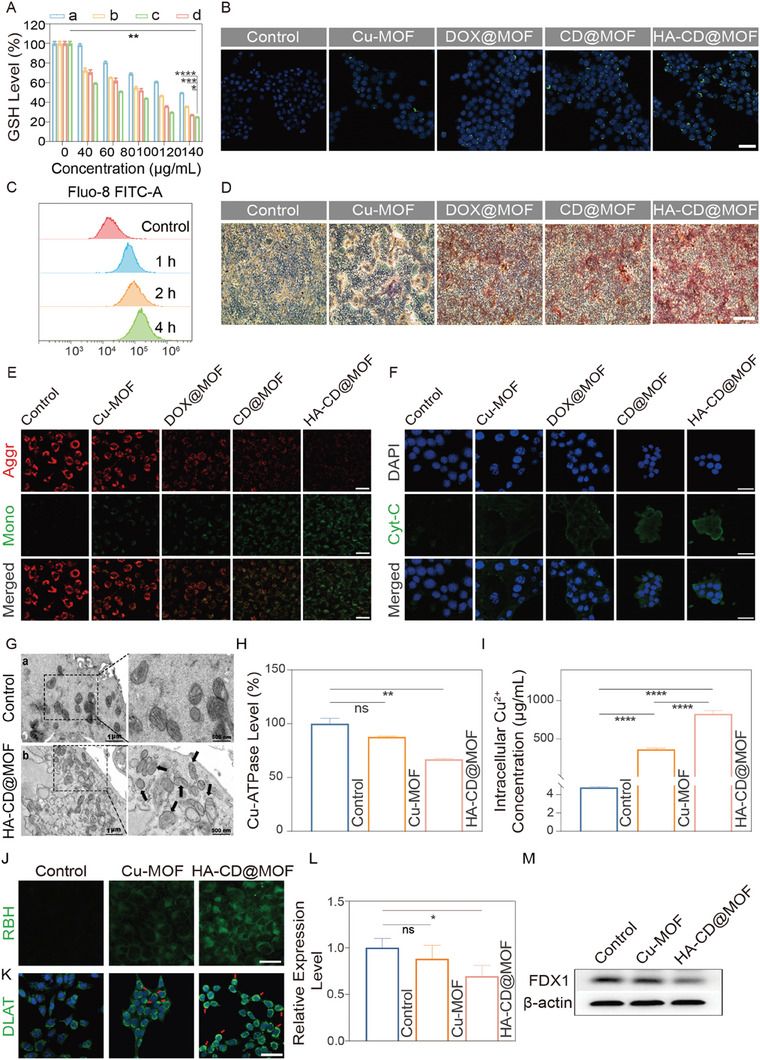
Figure 4.

Evaluation of cascade mitochondrial injury sensitization to cuproptosis caused by HA‐CD@MOF NPs. A) GSH levels in 4T1 cells after different treatments: a) Cu‐MOF, b) DOX@MOF, c) CD@MOF, d) HA‐CD@MOF, n = 3. B) CLSM images of intracellular uptake of Ca2+ in 4T1 cells after different treatments (scale bar: 50 µm). C) FCM analysis of Ca2+ levels in 4T1 cells after incubation with HA‐CD@MOF NPs at various time points. D) Identification of exocytosis products of tumor cells via Alizarin Red staining (scale bar: 500 µm). E) CLSM images of JC‐1‐stained 4T1 cells under different conditions (scale bars: 50 µm). F) CLSM images of Cyt‐C in 4T1 cells treated with control, Cu‐MOF, DOX@MOF, CD@MOF, and HA‐CD@MOF NPs (scale bars: 50 µm). G) Bio‐TEM of mitochondria in a) untreated 4T1 cells and b) HA‐CD@MOF NP‐treated 4T1 cells. H) Cu‐ATPase activity after different treatments; n = 3. I) Intracellular Cu2+ concentration after different treatments; n = 3. J) CLSM images of intracellular Cu2+ accumulation after treatment with the control, Cu‐MOF, and HA‐CD@MOF NPs in 4T1 cells (scale bars: 25 µm). K) CLSM images of DLAT aggregation (red arrows) in 4T1 cells after treatment with control, Cu‐MOF, and HA‐CD@MOF NPs (scale bar: 50 µm). L) The corresponding quantitative analysis of FDX1 protein expression based on western blotting results, n = 3. M) Western blotting results of cuproptosis markers in 4T1 cells treated with control, Cu‐MOF, and HA‐CD@MOF NPs. Results are presented as means ± SD. *p < 0.05, **p < 0.01, ***p < 0.001, ****p < 0.0001.
