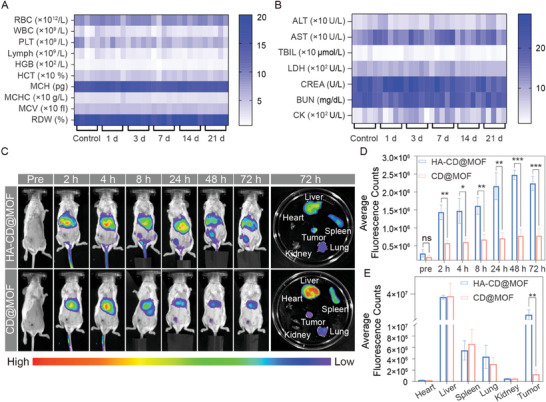
Figure 5.

Biosafety and tumor‐targeting assay of HA‐CD@MOF in vivo. A) Routine blood (left) and B) blood biochemistry (right) analysis of mice sacrificed on certain days after HA‐CD@MOF NP treatment; n = 5. C) Fluorescence images of mice treated with CD@MOF NPs and HA‐CD@MOF NPs at different time points in vivo and ex vivo fluorescence images of the main organs and tumors harvested from mice at 72 h. D) Quantitative analysis of fluorescence intensity at the tumor site in vivo; n = 3. E) Quantitative analysis of fluorescence intensity in the main organs and harvested tumors ex vivo; n = 3. The results are presented as means ± SD. *p < 0.05, **p < 0.01, ***p < 0.001, ****p < 0.0001.
