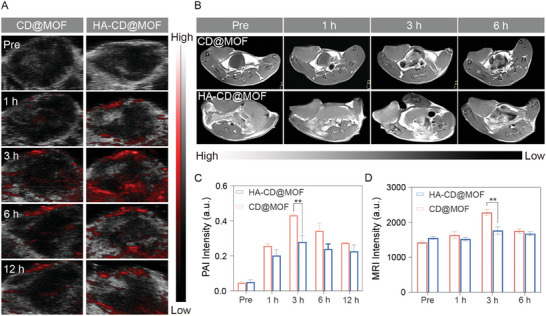
Figure 6.

PAI/MRI ability of HA‐CD@MOF NPs. A) PAI images of the tumor after treatment with CD@MOF NPs and HA‐CD@MOF NPs. B) T1‐weighted images of the tumor at various time points after intravenous injection of CD@MOF NPs and HA‐CD@MOF NPs. C) Quantitative analysis of PAI intensity of the tumor; n = 3. D) T1‐weighted MRI signal intensity of the tumor; n = 3. Results are presented as means ± SD. *p < 0.05, **p < 0.01, ***p < 0.001, ****p < 0.0001.
