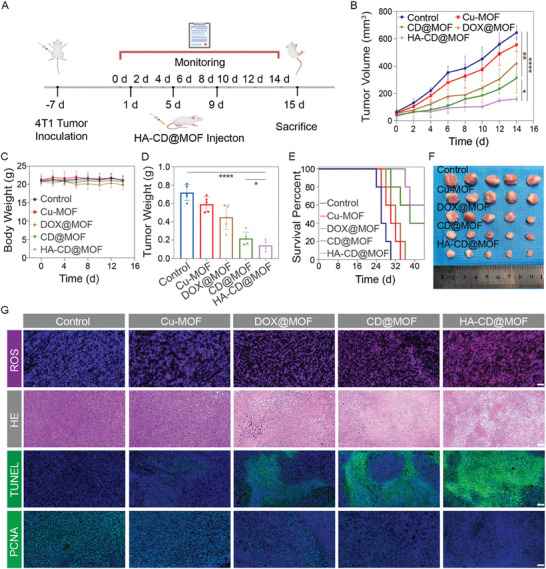
Figure 7.

Antitumor effects of HA‐CD@MOF NPs in vivo. A) Therapeutic process of HA‐CD@MOF NPs. B) Average tumor growth curves of tumor‐bearing mice after various treatments; n = 5. C) Body weight change curves of tumor‐bearing mice receiving different treatments; n = 5. D) Average weights of tumor excised from 4T1‐tumor‐bearing mice at day 15; n = 5. E) Survival curves of mice after various treatments; n = 5. F) Digital photos of harvested tumors; n = 5. G) ROS, H&E, terminal deoxynucleotidyl transferase dUTP nick‐end labeling (TUNEL), and proliferating cell nuclear antigen (PCNA) staining of tumor tissues from mice (scale bars: 100 µm). Results are presented as means ± SD. *p < 0.05, **p < 0.01, ***p < 0.001, ****p < 0.0001.
