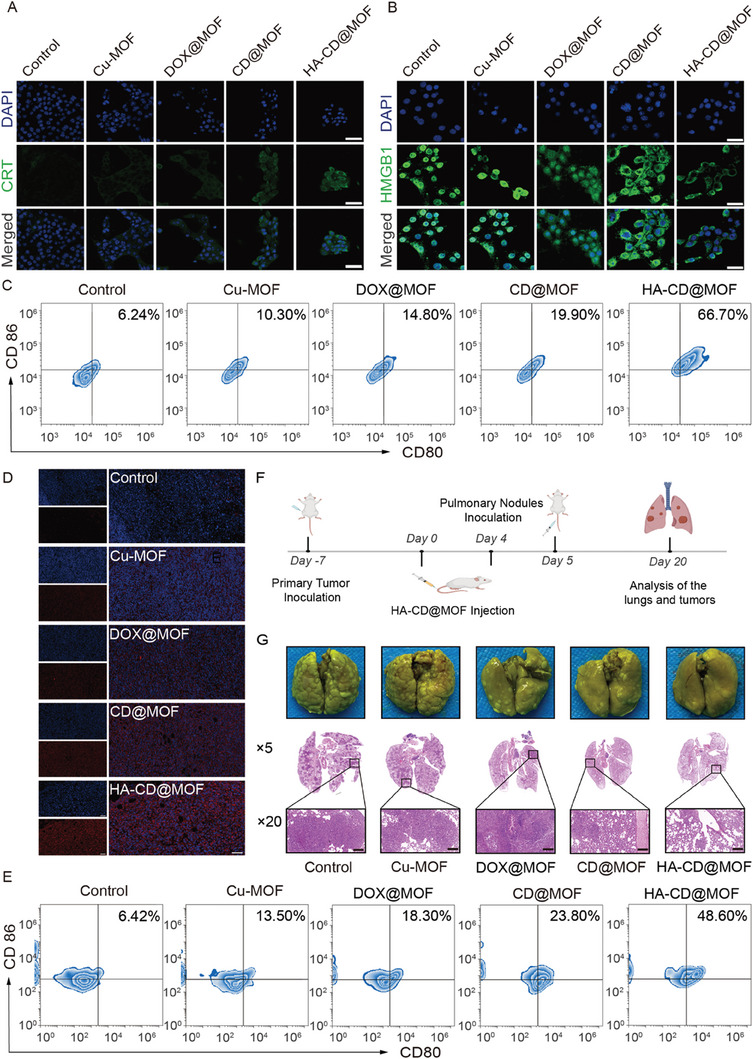
Figure 8.

Immunotherapy and metastasis suppression performance of HA‐CD@MOF NPs. CLMS images of A) CRT expression and B) HMGB1 release profiles of 4T1 cells (scale bars: 50 µm). C) FCM analysis of DC maturation stimulated by HA‐CD@MOF NPs in vitro. D) Immunofluorescence staining of CRT expressed in tumor tissues from mice (scale bars: 100 µm). E) DC maturation in vivo measured via FCM. F) Schematic illustration of the lung metastasis suppression experimental process. G) Bouin's tri‐chrome fixed lung tissue of mice after sacrifice and the corresponding H&E staining images (scale bars: 200 µm).
