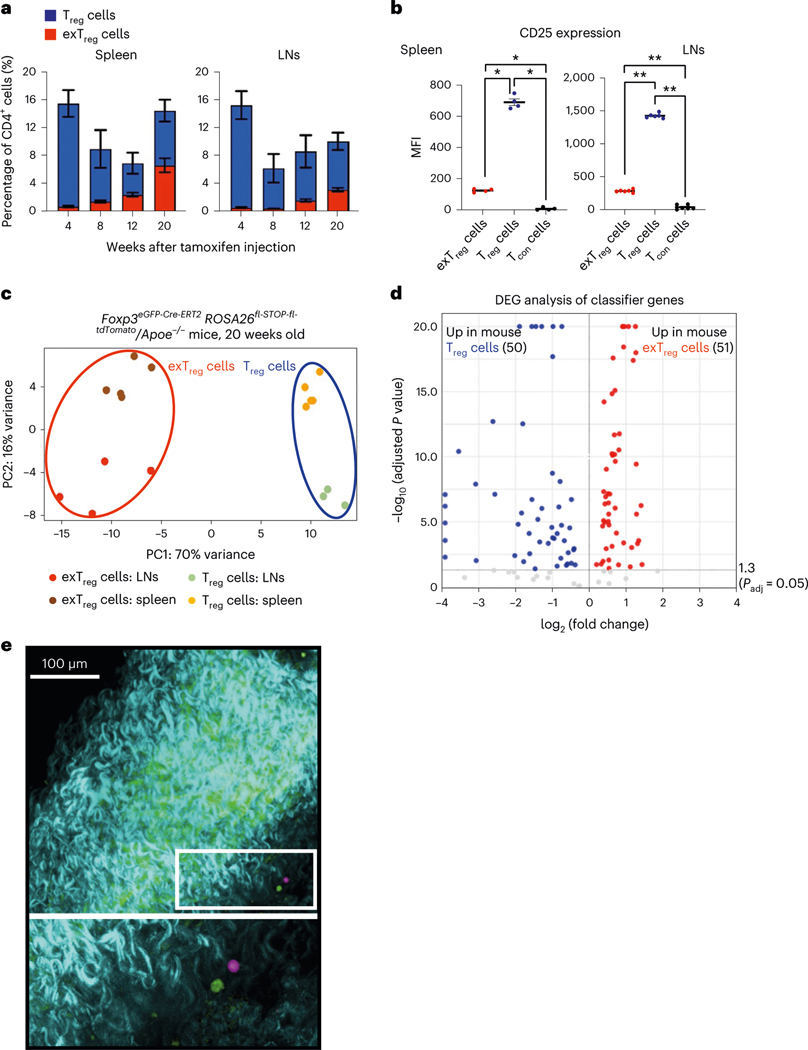
Fig. 1 |. Deep transcriptomes from mouse exTreg cells and Treg cells identify differentially expressed candidate genes.
a, Frequency of mouse exTreg cells (red) and Treg cells (blue) among all CD4+T cells in spleen and LNs of FoxP3eGFP-Cre-ERT2ROSA26CAG-fl-stop-fl-tdTomato Apoe−/− mice at 4 (Treg n = 7; exTreg n = 5), 8 (Treg n = 4; exTreg n = 4), 12 (Treg n = 5; exTreg n = 5) and 20 (Treg n = 6; exTreg n = 5) weeks after tamoxifen injection. All mice were on regular CD. b, Median fluorescence intensity (MFI) of CD25 expression on exTreg cells (red circles), Treg cells (blue circles) and conventional CD4+T cells (Tcon, black circles) in spleen (n = 4) and LNs (n = 6) from 16-week-old FoxP3eGFP-Cre-ERT2ROSA26CAG-fl-stop-fl-tdTomato Apoe−/− mice on CD. Results (a and b) are represented as the mean ± s.e.m. Spleen (b) *P = 0.0286; LN (b) **P = 0.0022; two-tailed Mann–Whitney U test. c, PCA of bulk RNA-seq data from sorted mouse exTreg cells and Treg cells from spleen and LNs of 20-week-old FoxP3eGFP-Cre-ERT2ROSA26CAG-fl-stop-fl-tdTomato Apoe−/− mice on CD. Results (a–c) are from independent biological replicates. d, Volcano plot of differentially expressed mouse exTreg and Treg cell-classifying genes, identified by the SVM trained on mouse transcripts with human orthologs and filtered for those present in the human scRNA-seq targeted gene panel. y and x axes capped at 20 (P = 10−20) and ±4 (log2FC), respectively. Horizontal line at −log10 (P adjusted) = 1.3 (same as Padj = 0.05). Statistical analyses were performed using a two-tailed Wald test with Benjamini–Hochberg P-value adjustment. e, Mouse aortas with carotid artery branches from FoxP3eGFP-Cre-ERT2ROSA26CAG-fl-stop-fl-tdTomato Apoe−/− mice were fixed and imaged using a Leica SP8 multiphoton microscope. GFP+ Treg cells (pseudocolored green) and tdTomato+ exTreg cells (pseudocolored pink) in the adventitia (top). Bottom image is a zoomed-in view of the white box. Blue-green indicates a second harmonic generation microscopy analysis of extracellular matrix. Scale bar, 100 μm. Data are representative of four independent experiments.

