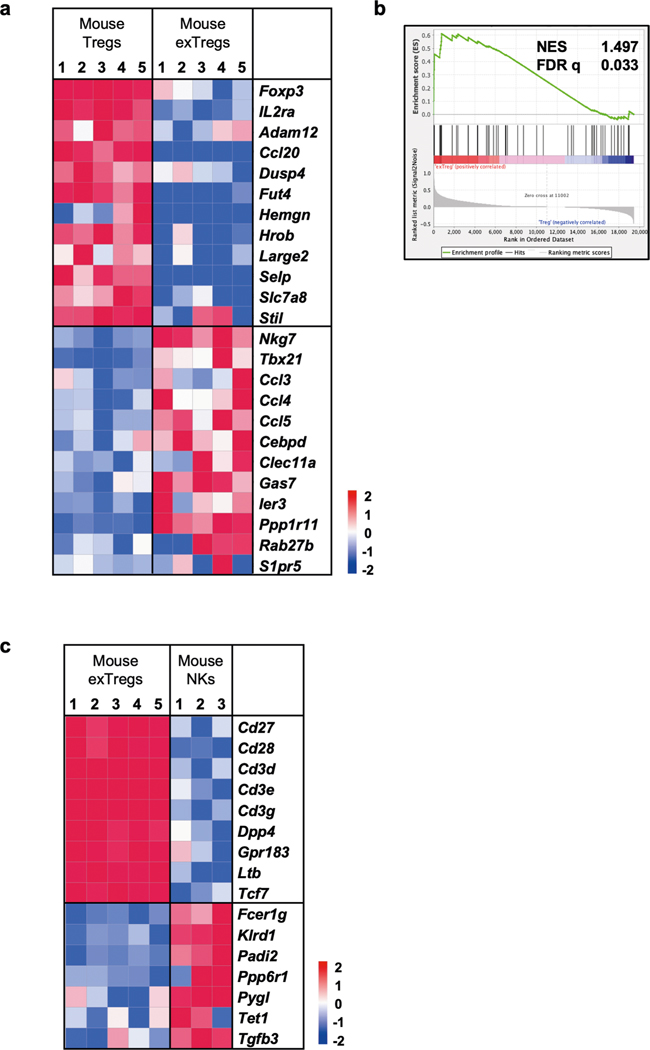
Extended Data Fig. 4 |. Mouse bulk RNAseq.
(a) Comparative gene signature analysis between mouse exTregs and Treg cells. Genes were filtered for significant differential expression in mouse and human dataset. Gene expression shown here is from FoxP3eGFP-Cre-ERT2 ROSA26CAG-fl-stop-fl-tdTomato Apoe−/− mice. Low-expressed genes (<7 raw reads in all samples) in our dataset were filtered out. Technical replicates were averaged, biological replicates shown as columns. Analysis of differentially expressed (DE) genes was done using DESeq2. Curated list of significant DE (log2FC ± 1, adjusted p < 0.05) genes are shown on normalized heatmaps, scaled by row (z scores). (b) Gene set enrichment analysis (GSEA) of mouse exTreg genes from bulk RNA-seq transcriptomes against human exTreg (left) and Treg cells (right) from the human bulk RNA-seq data set. Mouse orthologs of human genes, filtered for those present in the human scRNA-Seq targeted gene panel, were used to calculate enrichment for mouse bulk RNA-seq dataset. (c) Comparative gene signature analysis between mouse exTreg and NK cells. An external dataset was used for mouse NK cells (3 samples): GSE122597, GSE116177, and GSE52043. EdgeR was used to normalize the counts by applying the trimmed mean of M-values (TMM) method and counts per million (CPM) conversion. All other data processing and filtering steps were same as in a. Curated list of significant DE (log2FC ± 1, adjusted p < 0.05) genes are shown on normalized heatmaps, scaled by row (z scores). Statistical analyses of DE genes (a,c) using two-tailed Wald test with Benjamini-Hochberg correction for p-value adjustment. All data from independent biological replicates.

