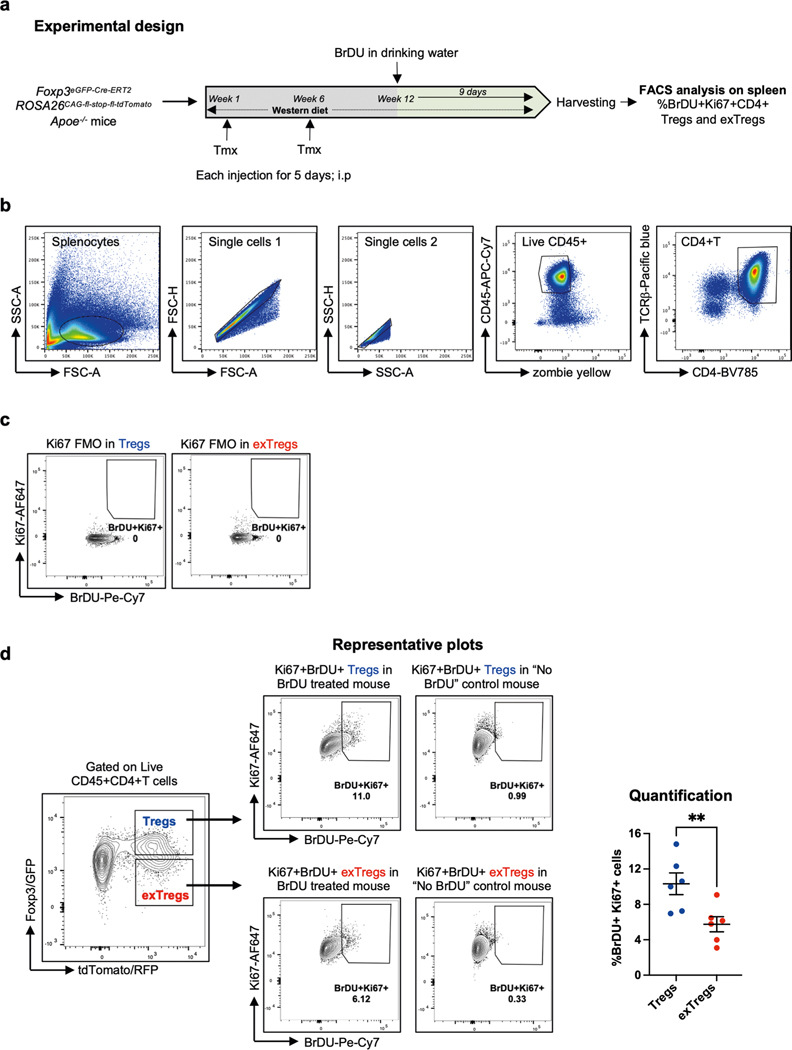
Extended Data Fig. 5 |. Assessment of proliferation in mouse Treg cells and exTregs.
(a) Eight week-old female Foxp3eGFP-Cre-ERT2 ROSA26fl-STOP-fl-tdTomato Apoe−/− mice were injected with Tamoxifen twice for 5 days each, at week 1 and 6, then fed Western diet (WD) for 12 weeks. BrDU (0.8 mg/mL) was incorporated in the drinking water for the last 9 days of WD (n = 6). (b) Gating scheme for CD4+T cells. (c) Ki67 FMO control. (d) Representative plots and quantification of proliferating Treg cells (blue circles, %Ki67+BrDU+CD4+Foxp3+RFP+) and exTregs (red circles, %Ki67+BrDU+CD4+Foxp3−RFP+) in the spleen (n = 6), as identified by anti-BrDU and anti-Ki-67 Abs. Data shown as mean ± SEM. Each animal is an independent biological replicate. Gates were set by FMO for Ki67 and by no BrdU controls for BrdU. Background from “No BrDU” control was subtracted for normalization. The percentage of proliferating cells was compared by two-tailed Mann-Whitney U test, **p = 0.0087.

