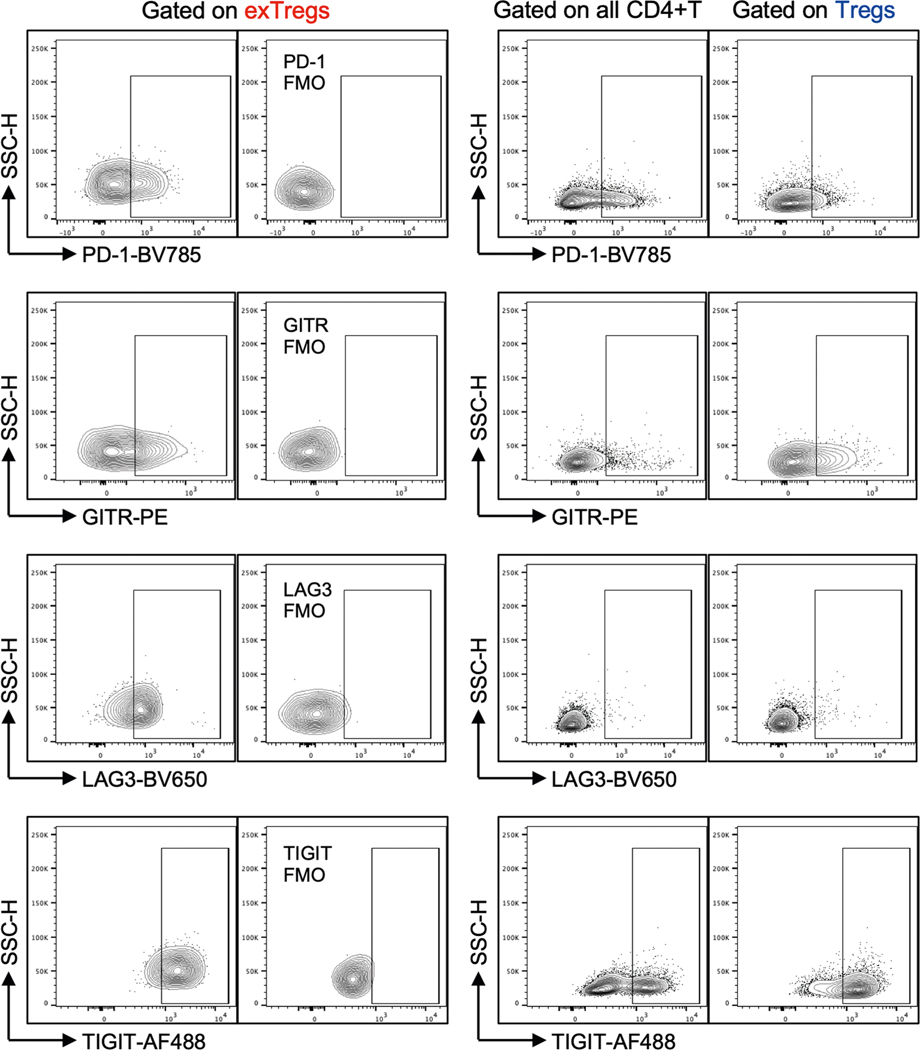
Extended Data Fig. 6 |. Treg marker expression on human exTregs.
Representative contour FACS plots showing the expressions of PD-1, GITR, LAG3 and TIGIT in exTreg cells (left). Corresponding FMO controls were used to set the gates. Right, contour plots showing the expression of these markers in all CD4+T cells and in Treg cells from the same donor.

