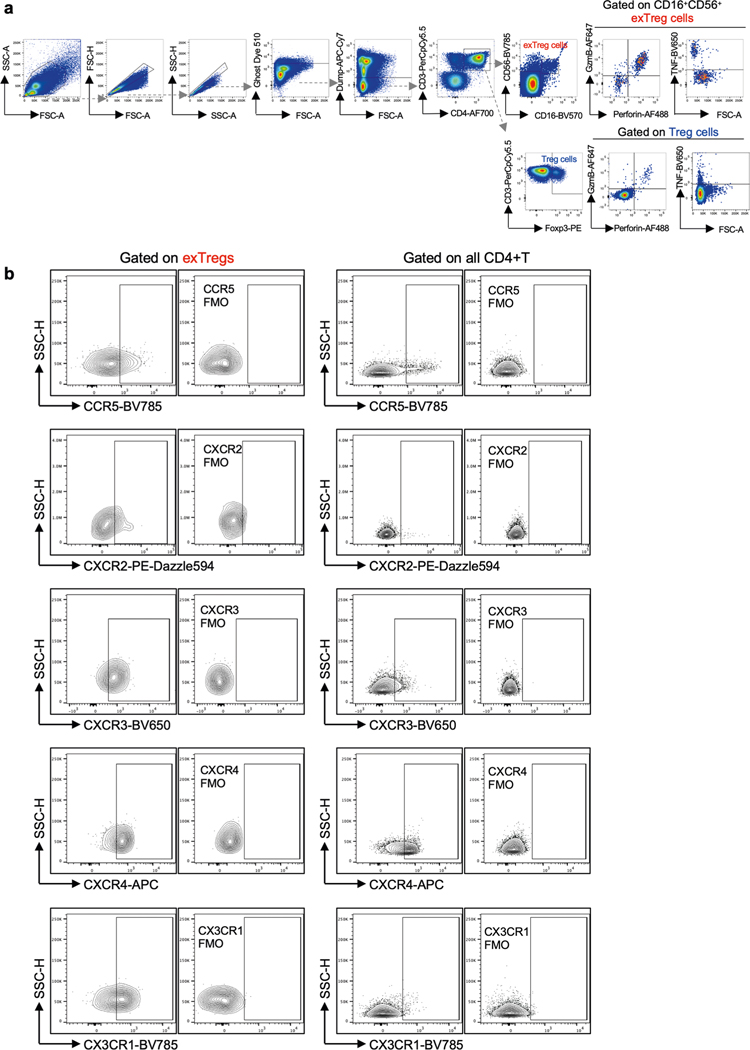
Extended Data Fig. 8 |. Gating strategy and representative plots.
(a) Gating strategy used to analyze granzyme B, perforin and TNF in Treg cells and exTregs. (b) Contour plots show surface expression of chemokine receptors CCR5, CXCR2, CXCR3, CXCR4 and CX3CR1 on exTreg cells (left) and their corresponding expression in all CD4+T cells (right). Individual FMO controls were used to set the gate for expression of each receptor.

