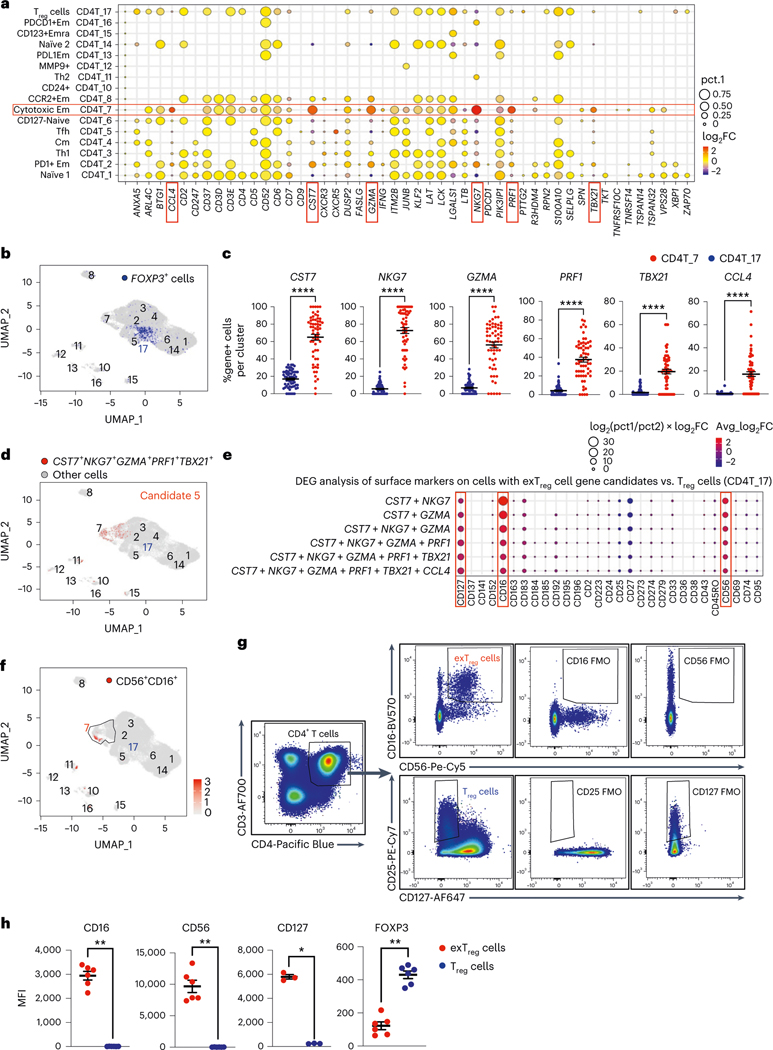
Fig. 2 |. Mouse exTreg cell classifier genes identify human exTreg cell candidate genes and surface markers in a human scRNA-seq and CITE-seq dataset of CD4+T cells.
a, Differentially expressed mouse exTreg classifier genes were examined among all CD4+ T cell clusters from a published single-cell human dataset from 61 men and women (aged 40–80 years). Statistical significance for the enrichment of each gene in one cluster versus all others was assessed. Average log2 fold change (log2FC, dot color) and positive cell proportions (pct.1, dot size) for significantly (P < 0.05) enriched genes are shown. Six highly expressed exTreg genes (CST7, NKG7, GZMA, PRF1, TBX21 and CCL4) enriched in human cluster CD4T_7 (red boxes). b, Feature plot showing expression of FOXP3 gene (blue dots) in the human CD4+ T single-cell dataset. Treg cell cluster CD4T_17, previously identified as Treg cells, highlighted. c, Frequencies of cells that expressed each of the exTreg cell signature genes in CD4T_7 (red circles) and CD4T_17 (Treg cells, blue circles). n = 61. d, Cells expressing optimal exTreg cell candidate gene combination (CST7 + NKG7 + GZMA + PRF1 + TBX21) are highlighted in red on UMAP embeddings of CD4+ T clusters from the scRNA-seq data. All other cells are in gray. e, Differentially expressed surface markers (CITE-seq antibodies) on cells expressing candidate gene combinations. Average log2FC (dot color) and log2(pct.1/pct.2) × avg_log2FC (dot size) for significant (P < 0.05) differentially expressed protein markers on candidate cells versus CD4T_17 (Treg cells) are shown. Enriched exTreg markers CD127, CD16 and CD56 are marked with red boxes. The second-to-last combination is candidate 5 (CST7 + NKG7 + GZMA + PRF1 + TBX21). f, UMAP embeddings of CD4+ T clusters. Black outline marks cluster CD4T_7; cells that coexpressed CD16 and CD56 are shown as red dots. g, Representative plots from flow cytometry (FACS) showing CD16+CD56+CD4+T cells (exTreg cells, red) and CD25+CD127loCD4+T cells (Treg cells, blue) with FMO controls. h, MFI of CD16 (n = 6), CD56 (n = 6), CD127 (n = 3) and FOXP3 (n = 6) expression in exTreg cells (red circles) and Treg cells (blue circles). 20% male, 80% female donors; ages 23–64 years. Results (c and h) are represented as the mean ± s.e.m. Each dot (c and h) represents a biological replicate from an independent human donor. Statistical comparisons using a two-tailed Mann–Whitney U test (c and h) and a two-tailed Wilcoxon’s rank-sum test with Benjamini–Hochberg correction for multiple comparisons (a and e). In c, ****P < 0.000000000000001 for CST7, NKG7, GZMA, PRF1 and ****P = 3.86 × 10⁻¹³ for TBX21. In h, *P = 0.0121, **P = 0.0022.

