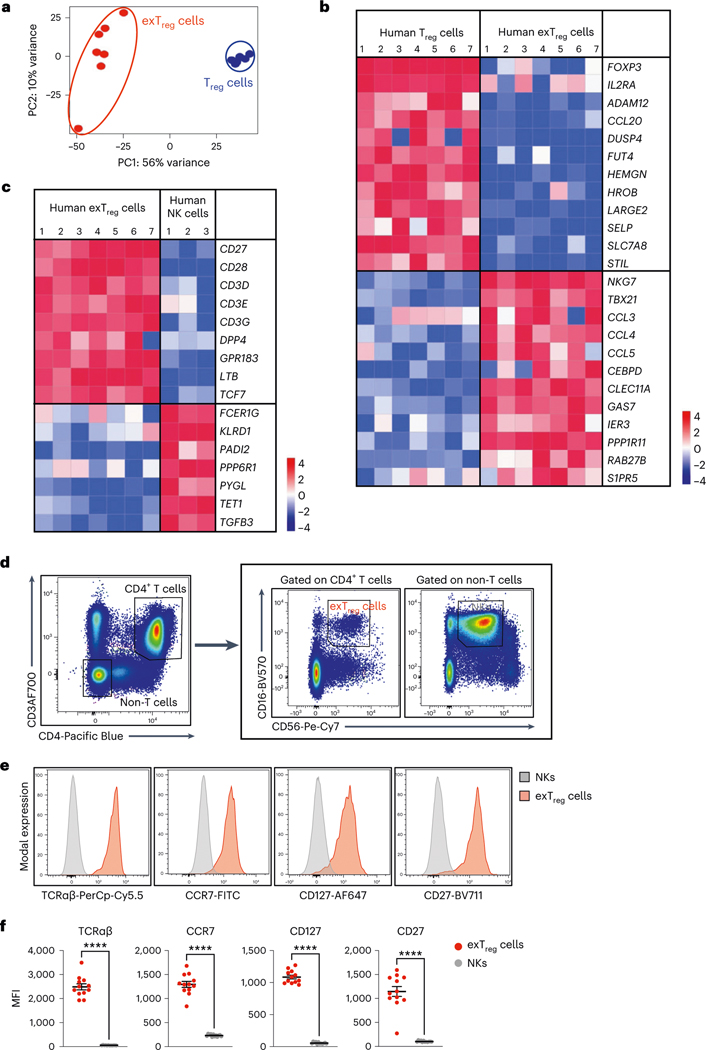
Fig. 3 |. Deep transcriptomes from sorted human CD3+CD4+CD16+CD56+ exTreg cells contrasted with Treg cells and NK cells.
a, PCA plot of bulk RNA-seq data from sorted human exTreg (CD3+CD4+CD16+CD56+) and Treg (CD3+CD4+CD25+CD127lo) cells. n = 7. Donor details for human bulk RNA-seq in Supplementary Table 13. b,c, Comparative gene signature analysis between human exTreg cells and Treg cells (b) or NK (c) cells. Genes were filtered for significant differential expression, consistent in both mouse and human datasets (only human shown here). An external dataset was used for human NK cells: GSE133383 (samples GSM3907331, GSM3907341 and GSM3907351). Lowly expressed genes (<7 raw reads in all samples) in our dataset were filtered out. EdgeR was used to normalize the counts by applying the trimmed mean of M-values method and counts-per-million conversion. Analysis of DEGs was done using DESeq2. Curated lists of significant DEGs (log2FC ± 1, adjusted P < 0.05) genes are shown on normalized heat maps, scaled by row (z scores). d, Representative FACS plots showing exTreg cells as CD3+CD4+CD16+CD56+ T cells and NK cells as CD3−CD4−CD16+CD56+ non-T cells in hPBMCs. e, Histograms showing the fluorescence intensities of conjugated antibodies against TCRαβ, CCR7, CD127 and CD27 on NK cells (gray) and exTreg cells (red). The scaled y axis was normalized to mode. f, MFI values of the specified markers (n = 12 for each) in NK cells (gray circles) and exTreg cells (red circles) were plotted as the mean ± s.e.m. 40% male and 60% female donors, aged 20–69 years. Each dot represents a biological replicate from an independent human donor. Statistical comparisons were done using a two-tailed Wald test with Benjamini–Hochberg correction for multiple testing (b and c) and a two-tailed Mann–Whitney U test (f). ****P = 7.396 × 10⁻⁷ in f.

