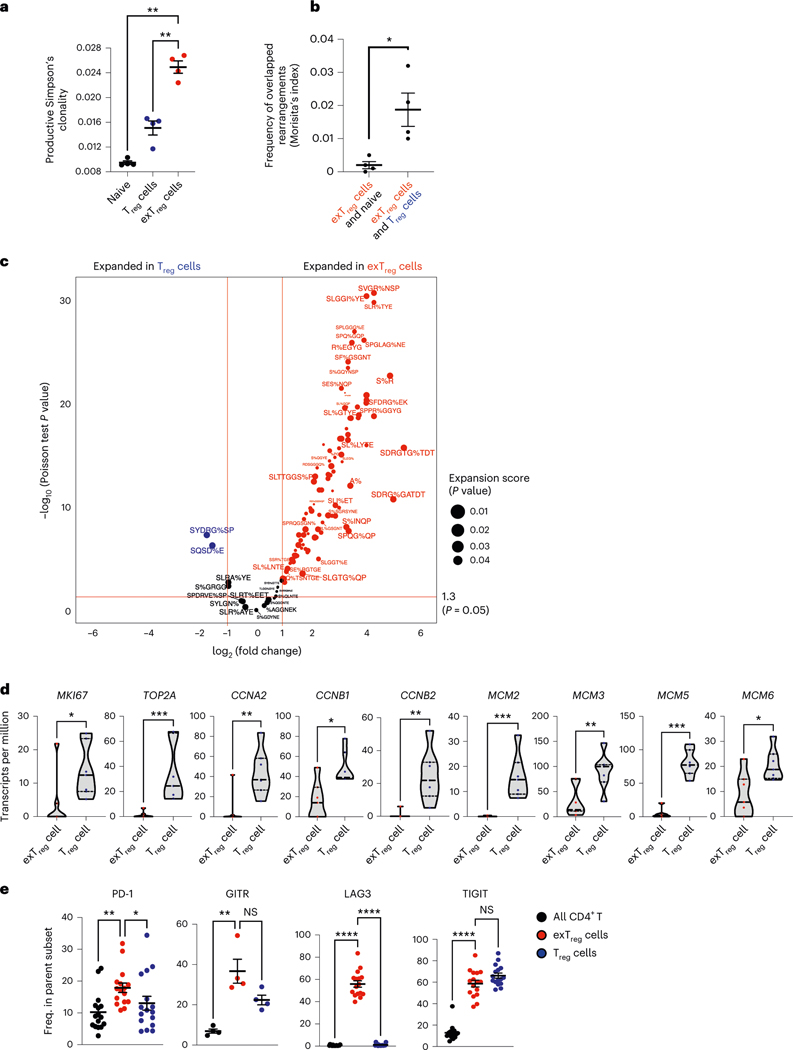
Fig. 4 |. Oligoclonal human exTreg cells are clonally expanded from proliferating Treg cells.
a, Productive Simpson’s clonality of TCRβ sequences from sorted naïve T cells (black circles), Treg cells (blue circles) and exTreg cells (red circles). n = 4. Donor details for human TCR-seq in Supplementary Table 13. b, Frequency of rearrangements shared between exTreg cells and naïve or between exTreg cells and Treg cells was measured using Morisita’s index. n = 4. Results (a and b) are represented as the mean ± s.e.m. c, GLIPH2-analyzed conserved amino acid motifs in TCRβ sequences. Groups with exTreg TCRs were filtered for statistically significant expansion score (P < 0.05). 178 of 345 expanded exTreg GLIPH2 groups were shared by Treg cells. Relative abundance of Treg and exTreg TCRs in these 178 Treg/exTreg groups was compared and DEG patterns (log2FC ± 1, two-sided Poisson test P < 0.05) are shown as a volcano plot. Horizontal line at −log10 (P value) = 1.3 (same as P = 0.05). Vertical lines at |log2FC| = 1. d, Violin plots showing normalized expression levels (transcripts per million) of proliferation genes MKI67, TOP2A, CCNA2, CCNB1, CCNB2, MCM2, MCM3, MCM5 and MCM6 in human bulk transcriptomes from sorted human Treg cells (blue dots) and exTreg cells (red dots). n = 7. 33.33% male and 66.67% female donors, aged 21–54 years. e, Frequency of PD-1 (n = 16), GITR (n = 4), LAG3 (n = 16) and TIGIT (n = 16) expressing cells by FACS, percentage of parent (all CD4+T cells (black circles), exTreg cells (red circles), Treg cells (blue circles); mean ± s.e.m.). 50% male and 50% female donors, aged 20–69 years. Each dot represents a biological replicate from an independent donor. Statistical comparisons were done using one-way analysis of variance (ANOVA) with Dunnett’s multiple-comparison test (a), a two-tailed Mann–Whitney U test (b and d) and a Kruskal–Wallis test, adjusted with Dunn’s multiple-comparison testing (e). In a, exTreg cells versus naive **P = 0.0012; versus Treg cells **P = 0.0068. In b, *P = 0.0286. In d, *P = 0.0111 for MKI67, CCNB1; *P = 0.0175 for MCM6; **P = 0.007 for CCNA2 and MCM3; **P = 0.0012 for CCNB2; ***P = 0.0006 for TOP2A, MCM2, MCM5. In e, PD-1 **P = 0.0023, GITR **P = 0.0047, LAG3 ****P = 3.21 × 10⁻⁷, TIGIT ****P = 5.227 × 10⁻⁵ for exTreg cells versus CD4+T cells; PD-1 *P = 0.0329, GITR P = 0.3396, LAG3 ****P = 1.659 × 10⁻⁵, TIGIT P = 0.423 for exTreg cells versus Treg cells. NS, not significant.

