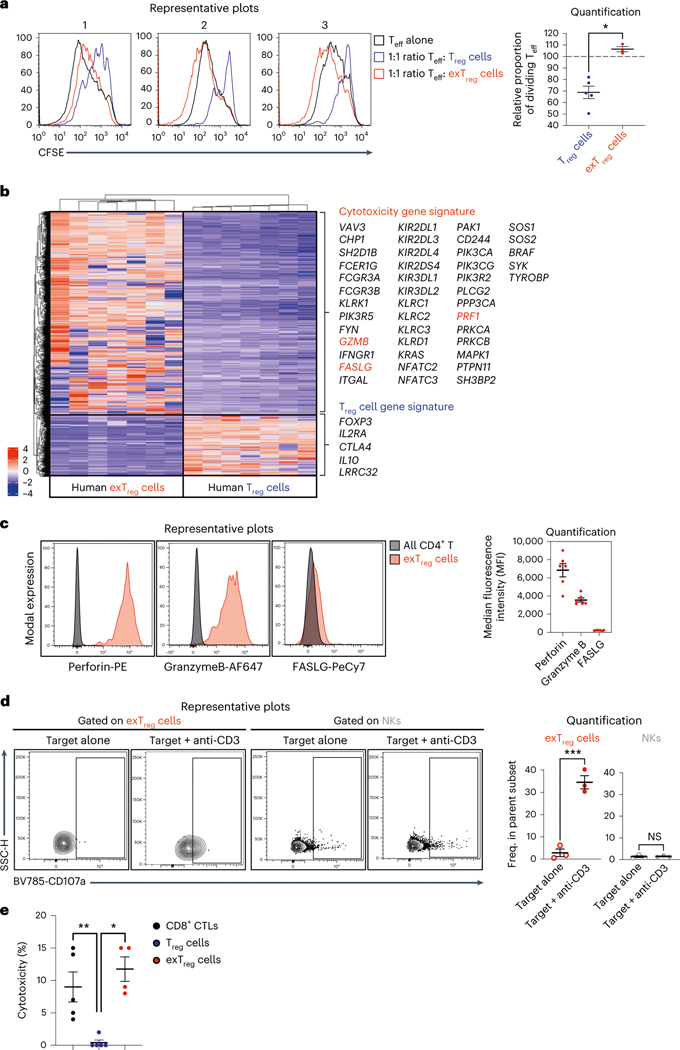
Fig. 5 |. Human exTreg cells are not suppressive but are cytotoxic.
a, CFSE-labeled CD3+CD4+CD25−T cells (Teff) were co-cultured at 1:1 ratio with either CTV-labeled Treg cells or exTreg cells, in the presence of anti-CD3/CD28/CD2-coated beads. Left, representative histograms from three independent experiments showing CFSE in Teff cells alone (black line), in Teff cells cultured with Treg cells (blue line) and in Teff cells cultured with exTreg cells (red line). Right, proportion of dividing Teff cells after 5 d of co-culture with Treg cells (blue circles, n = 5) or ex Treg cells (red circles, n = 3). 40% male and 60% female donors; aged 23–43 years. b, Heat map of DEGs (P < 0.01 and |log2FC| > 2, based on a two-tailed Wald test with Benjamini–Hochberg P-value adjustment) between human exTreg versus Treg transcriptomes from Fig. 3. Cytotoxic and Treg signature genes are highlighted. c, FACS analysis of cytotoxic proteins FASLG, perforin and granzyme B (genes are labeled red in b) in human exTreg cells, compared to bulk CD4+T cells. Left, representative histograms of intensities of fluorochrome-conjugated antibodies against FASLG, perforin and granzyme B on exTreg cells (red) and all CD4+T cells (black). Right, MFIs of marker protein expression in exTreg cells. n = 6. 50% male and 50% female donors, aged 25–37 years. d, Representative contour plots (left) and quantification (right) of basal and anti-CD3-induced degranulation in exTreg cells (red) and NK cells (gray), as measured by surface mobilization of the degranulation marker CD107a by FACS. hPBMCs were co-cultured with uncoated P815 cells (target alone, open circles) or 5 μg ml−1 anti-CD3-coated P815 cells (target + anti-CD3, filled circles) for 6 h at a 10:1 PBMC:P815 ratio. n = 3. 33.33% male and 66.67% female donors; aged 25–38 years. e, Anti-CD3-loaded P815 cells were co-cultured with CD8 CTLs (black circles, n = 5), Treg cells (blue circles, n = 5) or exTreg cells (red circles, n = 4) at a 1:5 P815:effector cells ratio for 16 h. 60% male and 40% female donors, aged 21–45 years. Cytotoxicity was assessed by measuring lactate dehydrogenase amounts in the supernatant. Results (a and c–e) are represented as the mean ± s.e.m. Each dot represents a biological replicate from an independent donor. Statistical comparisons were done using a two-tailed Mann–Whitney U test (a and e) and a two-tailed unpaired t-test (d). *P = 0.0357 (a). ***P = 0.0008 (d, exTreg cells); P = 0.7707 (d; NKs). **P = 0.0079 (e, Treg cells versus CTLs); *P = 0.0159 (e; Treg cells versus exTreg cells).

