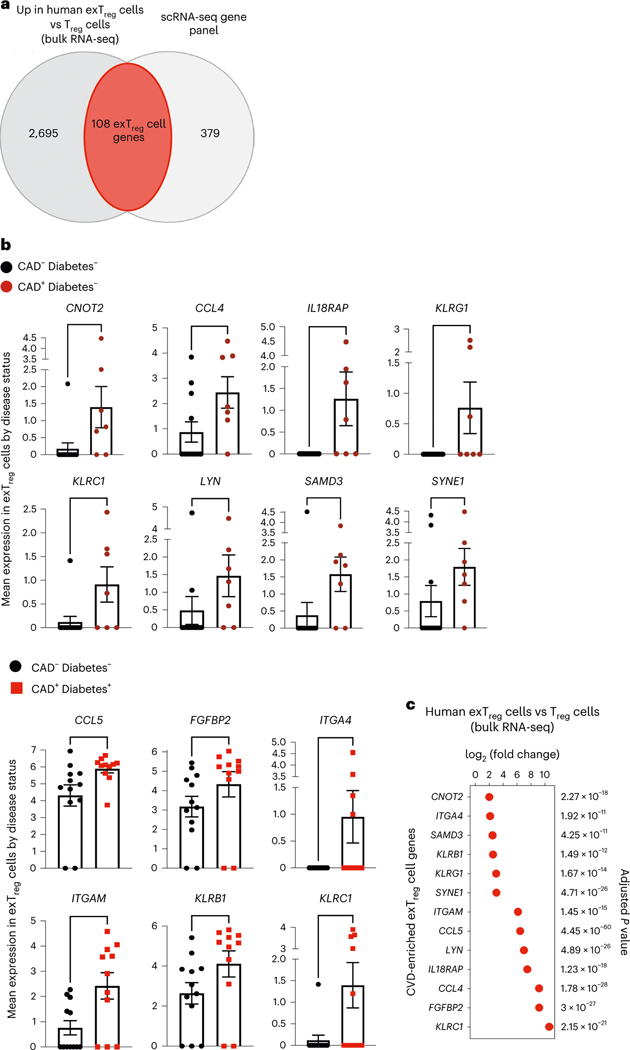
Fig. 7 |. Inflammatory and cytotoxic human exTreg genes overexpressed in individuals with coronary artery disease.
a, Genes that were significantly upregulated in human exTreg cells compared to Treg cells (2,803 genes) in the human bulk RNA-seq data (Fig. 3) were intersected with the genes present in the published human scRNA-seq panel (Fig. 2). Donor details for human bulk RNA-seq are in Supplementary Table 13 and those for scRNA-seq are in ref. 21. b, Mean expression of genes in CD16+CD56+ exTreg cells from the scRNA-seq dataset that were significantly increased in CAD+ non-diabetic (brown circles in top, n = 7) or diabetic (red squares in bottom, n = 11) individuals in comparison to control CAD− non-diabetic (black circles, n = 12) individuals. Results are shown as the mean ± s.e.m. Each point represents data from exTreg cells from an independent donor. Statistical comparisons were done using a two-tailed Mann–Whitney U test. Top, **P = 0.0064 (CNOT2), *P = 0.0414 (CCL4), **P = 0.009 (IL18RAP), *P = 0.0361 (KLRG1), *P = 0.0163 (KLRC1), *P = 0.0371 (LYN), **P = 0.0095 (SAMD3), *P = 0.0395 (SYNE1). Bottom, *P = 0.0126 (CCL5), *P = 0.0354 (FGFBP2), *P = 0.0373 (ITGA4), *P = 0.018 (ITGAM), *P = 0.031 (KLRB1), *P = 0.032 (KLRC1). c, log2FC and adjusted P values of a DEG analysis (based on a two-tailed Wald test with Benjamini–Hochberg P-value adjustment) between exTreg cells and Treg cells for the 13 CAD-relevant exTreg genes from b.

