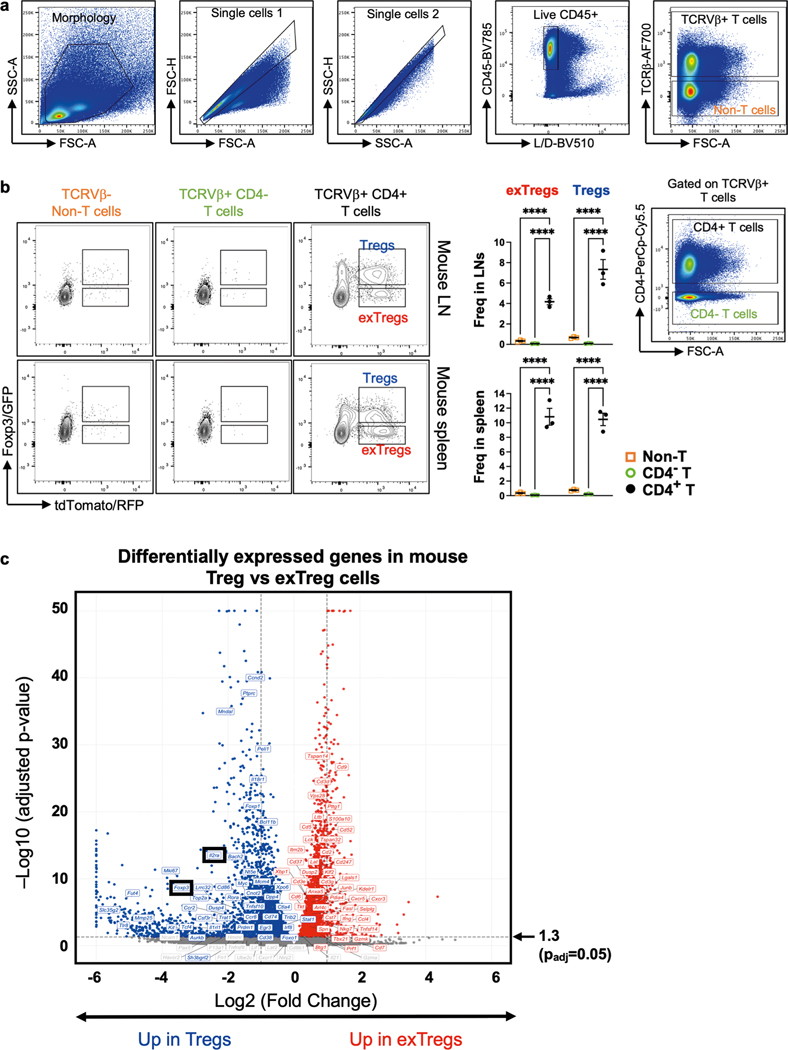
Extended Data Fig. 1 |. Experimental controls for lineage-tracker atherosclerotic mouse model and differentially expressed genes in mouse Treg cells vs exTregs.
(a,b) Eight week-old female Foxp3eGFP-Cre-ERT2 ROSA26fl-STOP-fl-tdTomato Apoe−/− mice were injected with Tamoxifen twice for 5 days each, at week 1 and 6, then fed Western diet (WD) for 12 weeks. a) gating strategy, b) representative plots and quantification of exTreg and Treg cells among CD4+T cells (black circles) in lymph nodes (LNs) and spleen, harvested after 12 weeks of WD from 3 independent mice. Non-T cells (orange open squares) and CD4−T cells (green open circles) are negative controls. Frequencies of exTregs and Treg cells among the parent subsets were plotted as mean ± SEM. Statistical comparisons were done using 2-way ANOVA with Dunnett’s multiple comparison test. **** p < 0.0001. c) Volcano plot representing significantly differentially expressed genes between mouse Treg cells and exTregs from 20-week old FoxP3eGFP-Cre-ERT2 ROSA26CAG-fl-stop-fl-tdTomato Apoe−/− mice (lymph nodes and spleen pooled). Left, up in Treg cells (blue). Right, up in exTregs (red). Horizontal dotted line is at -log10 (p adjusted) = 1.3 (padj = 0.05). The top 60 exTreg and 60 Treg classifying genes from the SVM model are annotated. Canonical Treg genes Il2ra and Foxp3 are shown in black boxes. Statistical analyses of DE genes using two-tailed Wald test with Benjamini-Hochberg correction for multiple comparisons.

