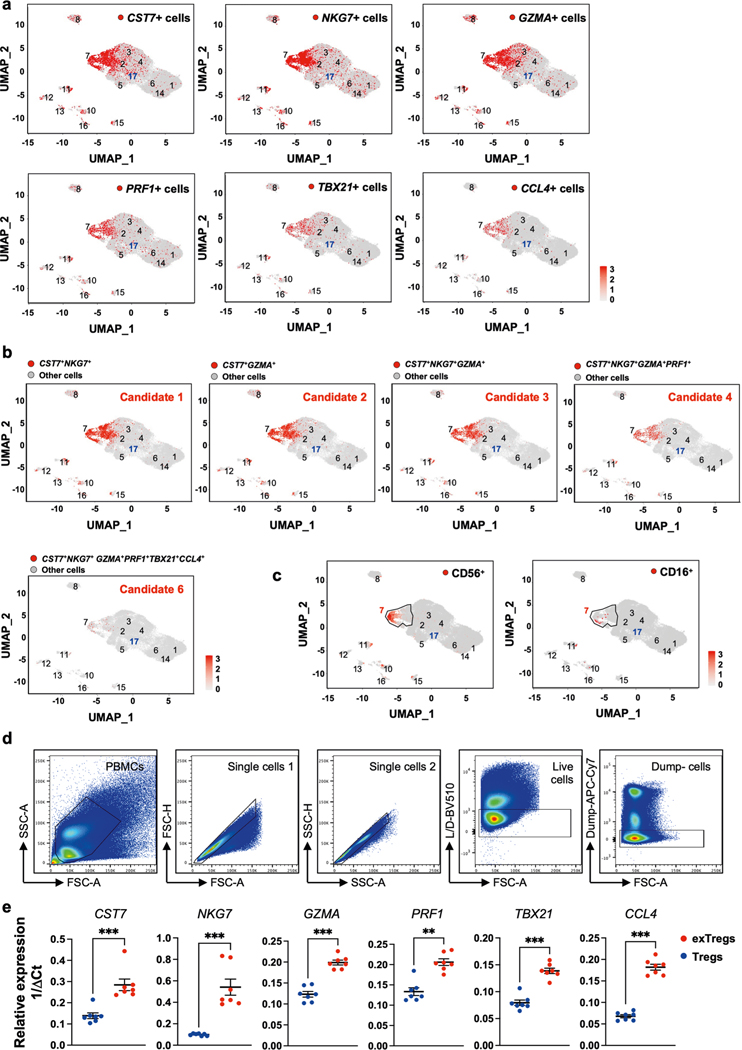
Extended Data Fig. 2 |. Expression of exTreg candidate genes in scRNAseq data and validation by qRT-PCR from sorted human cells.
(a) Feature maps showing the gene expression of the single gene markers CST7, NKG7, GZMA, PRF1, TBX21 and CCL4 in the human single-cell dataset for all CD4 T cell clusters. (b) Combinations 1–4 and 6 of exTreg candidate genes are highlighted in red on UMAP embeddings of CD4 T clusters from the scRNA-Seq. (c) UMAP embeddings of CD4 T clusters. Black outline marks cluster CD4T_7; cells that express either CD56 (left) or CD16 (right) are shown as red dots. (d) Gating strategy to identify exTreg and Treg cells in human PBMCs. Dump channel: CD14, CD19. (e) Gene expression analysis of CST7, NKG7, GZMA, PRF1, TBX21 and CCL4 in sorted human Treg cells (blue circles) and exTregs (red circles) by qRT-PCR. Gene-specific Ct values were normalized (ΔCt) based on actin (ACTB). Relative expression was calculated by the 1/ΔCt method. n = 7. 33.33% male, 66.67% female donors; age: 21–54 yrs. Data shown as mean ± SEM. Each dot represents a biological replicate from an independent donor. Statistical comparisons by two-tailed Mann Whitney U test. **p = 0.0012,***p = 0.0006.

