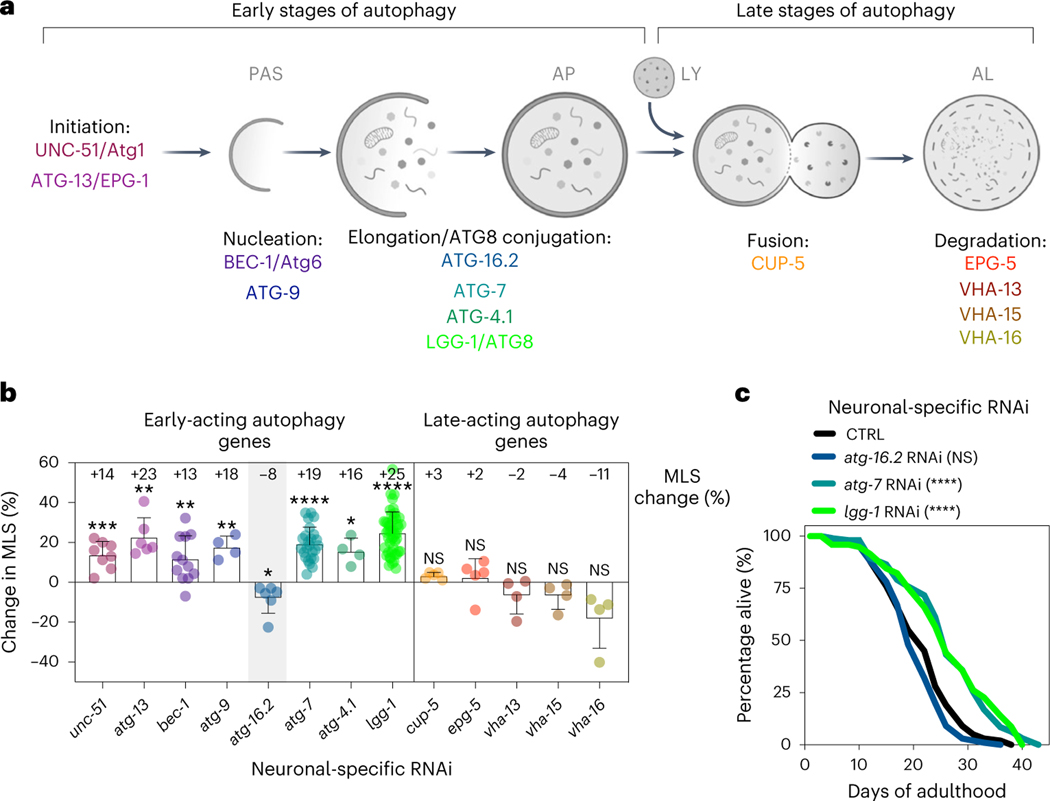
Fig. 1 |. With the exception of atg-16.2, neuronal inhibition of early-acting autophagy genes extends lifespan.
a, Schematic showing early-acting and late-acting genes in the autophagy process investigated in this study (see the introduction for additional information). Created using BioRender.com. b, Average mean lifespan change (% MLS change, indicated) in sid-1; rgef-1p::sid-1 animals after RNAi of the listed autophagy-related genes compared to control. All lifespan data were pooled irrespective of whole-life or adult-only RNAi initiation. Error bars indicate the s.d. P values: not significant (NS) P > 0.05, *P < 0.05, **P < 0.01, ***P < 0.001, ****P < 0.0001, by a two-sided, one-sample t-test compared to hypothetical mean of 0. See Supplementary Table 2 for n, all P values and statistical details and Supplementary Table 3 for details of individual lifespan experiments. Shading of atg-16.2 emphasizes this RNAi treatment as an exception for lifespan extension by early-acting autophagy genes. c, Lifespan analyses of sid-1; rgef-1p::sid-1 + rgef-1p::gfp animals after whole-life atg-16.2, atg-7 or lgg-1/ATG8 RNAi compared to control (CTRL). Statistical significance was determined by two-sided log-rank test, NS, P = 0.07, ****P < 0.0001. See Supplementary Table 3 for details and repeats.

