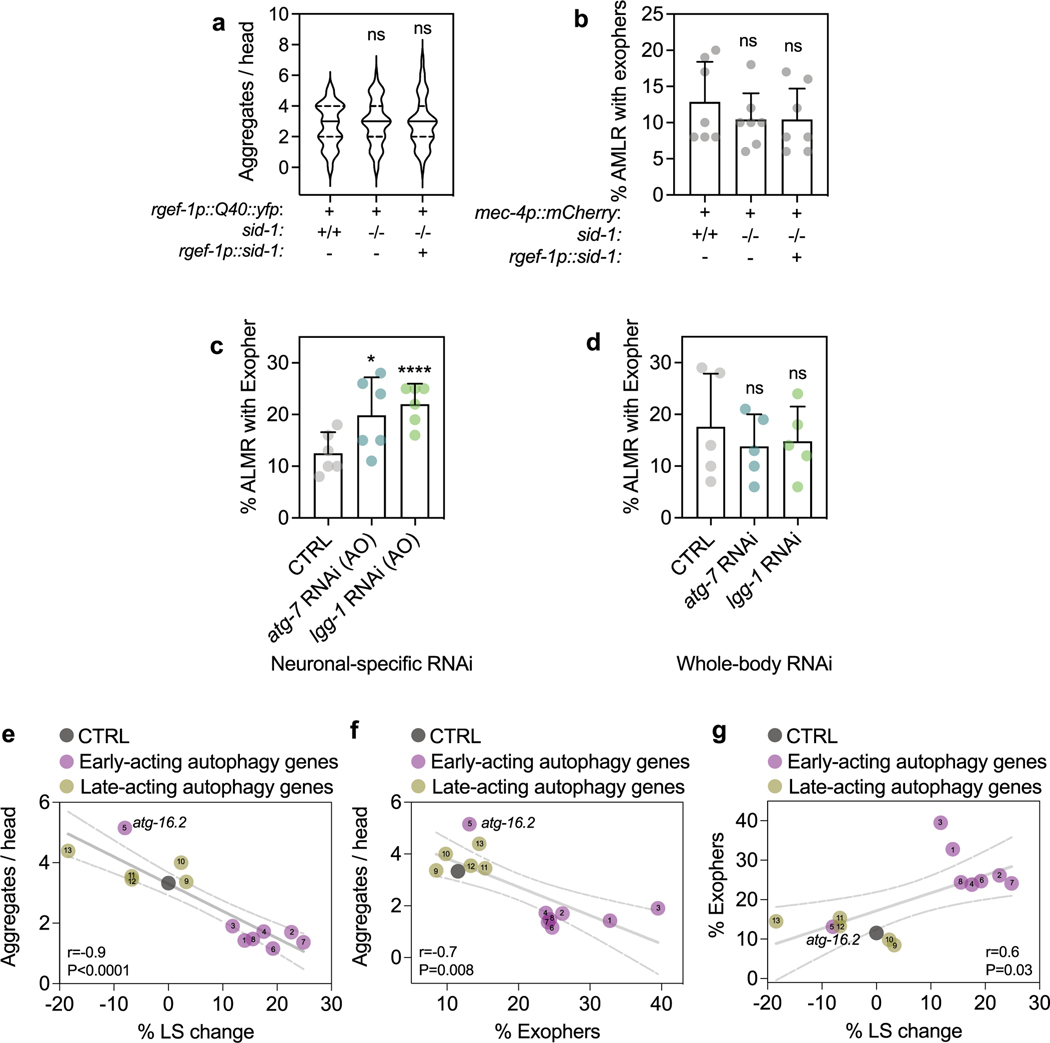
Extended Data Fig. 4 |. Neuronal PolyQ aggregation, exopher formation and lifespan extension are correlated.
(a) Number of neuronal PolyQ aggregates in day 7 rgef-1::Q40::yfp wild-type (sid-1 + /+) (n = 41) and sid-1(qt9) (sid-1−/−) animals (n = 48 with or without rgef-1p::sid-1 transgene (rgef-1p::sid-1 (+)) (n = 42). Violin plots with solid line indicating median and dashed lines indicating quartiles. ns P = 0.79, P = 0.82 by one-way ANOVA with Dunnett’s multiple comparisons test. (b) Mean percent of ALMR neurons with exophers of day 2 mec-4p::mCherry wild-type (sid-1 + /+) (n = 228 animals) and sid-1(qt9) (sid-1−/−) (n = 262 animals) with or without rgef-1p::sid-1 transgene (rgef-1p::sid-1 (+)) (n = 295 animals). Error bars are s.d. of n = 7 experiments, ns P = 0.62, P = 0.54 by two-sided Cochran-Mantel-Haenszel test. (c) Mean percent of ALMR neurons with exophers of day 2 sid-1; rgef-1p::sid-1 + rgef-1p::gfp; mec-4p::mCherry animals (n = 247 animals) after adult-only atg-7 (n = 271 animals), or lgg-1/ATG8 (n = 285 animals) RNAi compared to control (CTRL). Error bars are s.d. of n = 6 experiments, *P = 0.028, P = 0.00006 by two-sided Cochran-Mantel-Haenszel test. (d) Mean percent of ALMR neurons with exophers of day 2 mec-4p::mCherry animals (n = 151 animals) after whole-life atg-7 (n = 157 animals), or lgg-1/ATG8 (n = 180 animals) RNAi compared to control (CTRL). Error bars are s.d. of n = 5 experiments, ns P = 0.39, P = 0.53 by two-sided Cochran-Mantel-Haenszel test. (e-g) Percent mean lifespan (LS) change (Fig. 1b), number of neuronal PolyQ aggregates (Fig. 3b), and mean percent of AMLR neurons with exophers (Fig. 4b) plotted against each other with simple linear regression (solid line with 95% C.I. as dashed lines). Numbers refer to specific RNAi treatment; 1unc-51/ATG1, 2atg-13, 3bec-1/BECN1, 4atg-9, 5atg-16.2, 6atg-7, 7atg-4.1, 8lgg-1/ATG8, 9cup-5, 10epg-5, 11vha-13, 12vha-15, 13vha-16. P values determined by two-sided Spearman correlation test.

