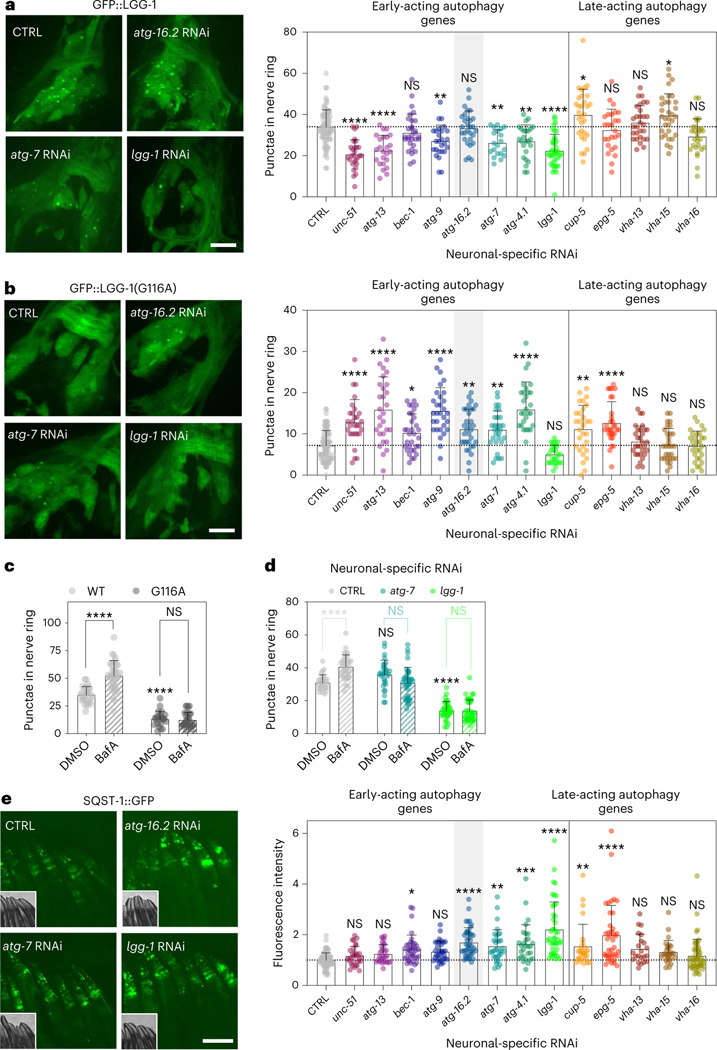
Fig. 2 |. Neuronal inhibition of all early-acting autophagy genes impairs autophagy.
a, Representative images of nerve-ring neurons and mean number of GFP::LGG-1/ATG8 punctae of day 1 sid-1; rgef-1p::sid-1; rgef-1::gfp::lgg-1 animals after whole-life autophagy gene RNAi. Error bars are s.d. NS P > 0.05, *P < 0.05, **P < 0.01, ***P < 0.001, ****P < 0.0001, by one-way analysis of variance (ANOVA) with Dunnett’s multiple-comparison test. See Supplementary Table 2 for n, all P values and statistical details. The brightness of the image displaying lgg-1/ATG8 RNAi was artificially enhanced. Scale bar, 10 μm. b, Representative images of nerve-ring neurons and mean number of non-lipidated GFP::LGG-1/ATG8(Gly116Ala) punctae in day 1 sid-1; rgef-1p::sid-1; rgef-1::gfp::lgg-1(Gly116Ala) animals after whole-life autophagy gene RNAi. Error bars are s.d. P values as in a. See Supplementary Table 2 for all P values and statistical details. The brightness of the nerve-ring image after lgg-1/ATG8 RNAi is artificially enhanced. Scale bar, 10 μm. c, Mean number of GFP::LGG-1/ATG8 punctae in nerve-ring neurons in day 1 rgef-1p::gfp::lgg-1 (WT)-expressing animals after injection of animals with vehicle (dimethylsulfoxide (DMSO); n = 27 animals) or BafA (n = 34 animals), and in animals expressing rgef-1p::gfp::lgg-1(Gly116Ala) (Gly116Ala; DMSO, n = 23; BafA, n = 28 animals), over three independent experiments. Error bars are s.d. NS P = 0.99, ****P < 0.0001, by two-way ANOVA with Tukey’s multiple-comparisons test. d, Mean number of GFP::LGG-1/ATG8 punctae in nerve-ring neurons after injection of animals with vehicle (DMSO) or BafA in day 1 sid-1; rgef-1p::sid-1; rgef-1::gfp::lgg-1 animals after whole-life atg-7 RNAi (DMSO, n = 30; BafA, n = 34 animals, NS P = 0.051) or lgg-1/ATG8 RNAi (DMSO, n = 33; BafA, n = 38 animals, NS P > 0.99) compared to control (CTRL) (DMSO, n = 27; BafA, n = 34 animals; ****P < 0.0001) over three independent experiments. Error bars are s.d. CTRL-DMSO versus atg-7-DMSO: NS P = 0.12; CTRL-DMSO versus lgg-1-DMSO: ****P < 0.0001, by two-way ANOVA with Tukey’s multiple-comparisons test. e, Representative images and mean fluorescence intensity in head regions of day 1 sid-1; rgef-1p::sid-1; sqst-1p::sqst-1::gfp animals after whole-life autophagy gene RNAi. Error bars are s.d. P values as in a. See Supplementary Table 2 for n, all P values and statistical details. Scale bar, 100 μm. Shading of atg-16.2 emphasizes this RNAi treatment as an exception for lifespan extension by early-acting autophagy genes (Fig. 1).

