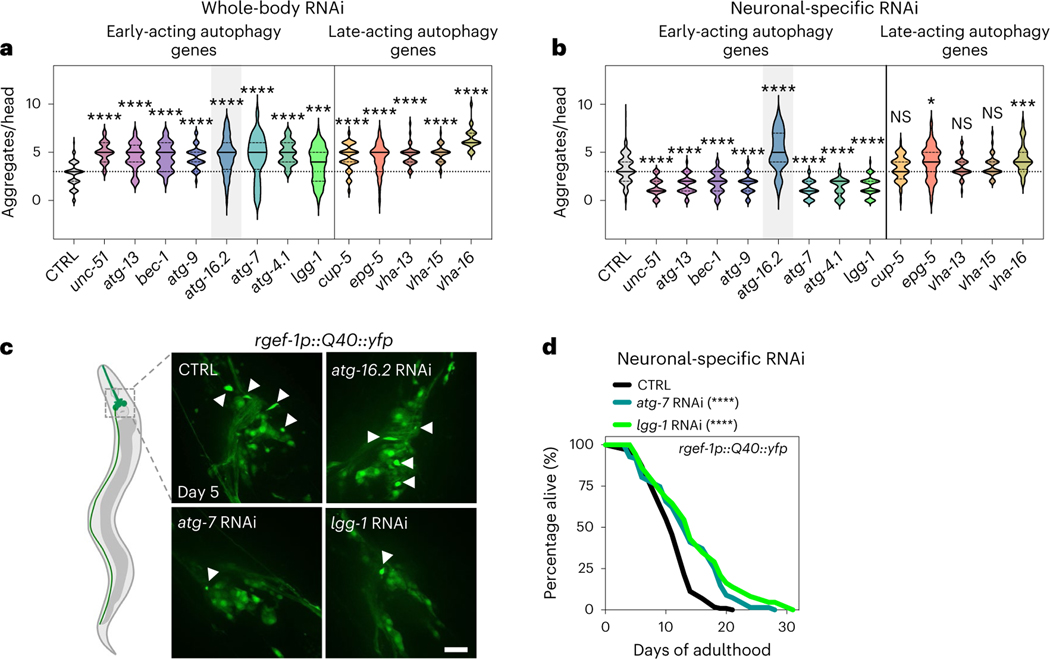
Fig. 3 |. Neuronal polyQ aggregation is increased by whole-body inhibition, but reduced by neuronal inhibition of early-acting autophagy genes, except atg-16.2.
a, Number of neuronal polyQ aggregates in day 5 rgef-1::Q40::yfp animals after whole-life autophagy gene RNAi, except for adult-only RNAi for vha-13, vha-15 and vha-16 to avoid larval arrest (unc-51/ULK and bec-1/BECN1 RNAi clones were previously tested by us with similar results9, and bec-1/BECN1 and atg-7 RNAi clones increase Htn-Q150 aggregation7). In the violin plots, the solid line indicates the median and dotted lines indicate quartiles. ***P < 0.001, ****P < 0.0001, by one-way ANOVA with Dunnett’s multiple-comparison test. See Supplementary Table 2 for n, all P values and statistical details. b, Number of neuronal polyQ aggregates in day 5 sid-1; rgef-1p::sid-1; rgef-1::Q40::yfp animals after whole-life autophagy gene RNAi. In the violin plots, the solid line indicates the median and dotted lines indicate quartiles. NS P > 0.05, *P < 0.05, ***P < 0.001, ****P < 0.0001, by one-way ANOVA with Dunnett’s multiple-comparison test. See Supplementary Table 2 for n, all P values and statistical details. Shading of atg-16.2 emphasizes this RNAi treatment as an exception for decreased polyQ aggregate number by early-acting autophagy genes. c, Representative images of nerve-ring neurons of day 5 sid-1; rgef-1p::sid-1; rgef-1::Q40::yfp animals after whole-life CTRL, atg-16.2, atg-7 or lgg-1/ATG8 RNAi with arrowheads indicating polyQ aggregates. Three experimental repeats. Scale bar, 20 μm. d, Lifespan analysis of sid-1; rgef-1p::sid-1 + rgef-1p::gfp; rgef-1::Q40::yfp animals after whole-life atg-7, or lgg-1/ATG8 RNAi compared to control (CTRL). Statistical significance was determined by two-sided log-rank test, ****P < 0.0001. See Supplementary Table 4 for details and repeats.

