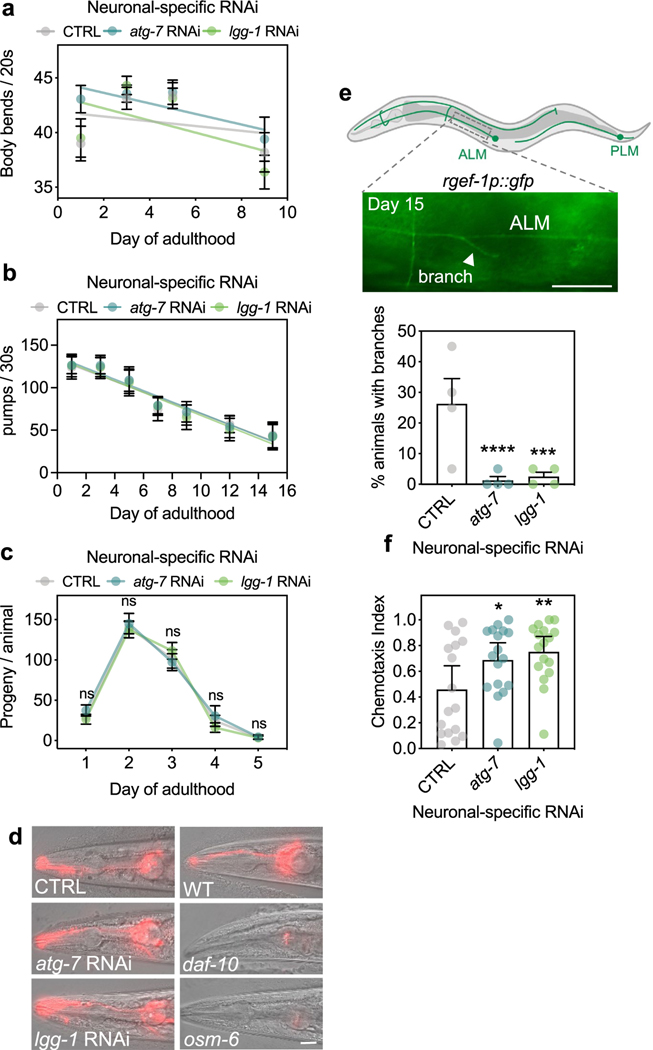
Extended Data Fig. 2 |. Healthspan and neuronal phenotypes of animals after neuronal inhibition of atg-7 and lgg-1/ATG8.
(a) Mean body bends per 20 s of sid-1; rgef-1p::sid-1 + rgef-1p::gfp animals after whole-life atg-7, or lgg-1/ATG8 RNAi compared to control (CTRL). Error bars are s.e.m. of one representative experiment, each with n = 16 animals. Experiment was performed three times with similar results. Linear regression comparison versus CTRL: atg-7 RNAi: Pslope = 0.5; Py-intercept = 0.02; lgg-1/ATG8 RNAi: Pslope = 0.3; Py-intercept = 0.01. (b) Mean number of contractions in the terminal pharyngeal bulb per 30 s of sid-1; rgef-1p::sid-1 + rgef-1p::gfp animals after whole-life atg-7, or lgg-1/ATG8 RNAi compared to control (CTRL). Error bars are s.d. of n = 30 animals over 3 independent experiments. Linear regression comparison versus CTRL: atg-7 RNAi: Pslope = 0.4; Py-intercept = 0.4; lgg-1 RNAi: Pslope = 0.3; Py-intercept = 0.5. (c) Mean number of progeny produced per day in sid-1; rgef-1p::sid-1 + rgef-1p::gfp animals after atg-7 (n = 19 animals), or lgg-1/ATG8 RNAi (n = 18 animals) compared to control (CTRL) (n = 22 animals) over 2 independent experiments. Error bars are s.d. CTRL versus atg-7 RNAi: ns P = 0.72, 0.89, 0.91, 0.82, >0.99; CTRL versus lgg-1/ATG8 RNAi: ns P = 0.95, 0.96,0.60, 0.70, >0.99, by two-way ANOVA with Dunnett’s multiple comparisons test. (d) Analysis of integrity of sensory neurons in day 5 sid-1; rgef-1p::sid-1 + rgef-1p::gfp animals after atg-7, or lgg-1/ATG8 RNAi compared to control (CTRL). Sensory mutants daf-10(e1387) and osm-6(p811) are negative controls. Shown are representative images of n = 10 animals. Experiment was performed three times with similar results. Scale bar, 20 μm. (e) Representative image of neuronal branch (arrowhead) from ALM neuron in day 15 sid-1; rgef-1p::sid-1+ rgef-1p::gfp animals. Scale bar: 20 μm. Mean percent of animals with branches after whole-life atg-7, or lgg-1/ATG8 dsRNA compared to control (CTRL) of n = 4 experiments. Error bars are s.d. ***P = 0.0002, ****P < 0.0001 by Cochran-Mantel-Haenszel test. (f) Mean chemotaxis index of day 5 sid-1; rgef-1p::sid-1 + rgef-1p::gfp animals after whole-life atg-7, or lgg-1/ATG8 RNAi using the chemoattractant butanone. Error bars are 95% C.I. of n = 4 experiments. *P = 0.048, **P = 0.0094, by one-way ANOVA with Dunnett’s multiple comparisons test.

