Figure 1.

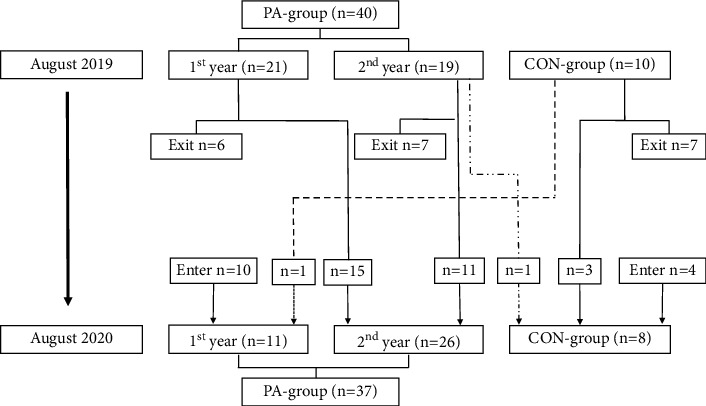
Flow chart of the movements between the groups of the participants between the two rounds of experiments, from August 2019 to August 2020.

Flow chart of the movements between the groups of the participants between the two rounds of experiments, from August 2019 to August 2020.