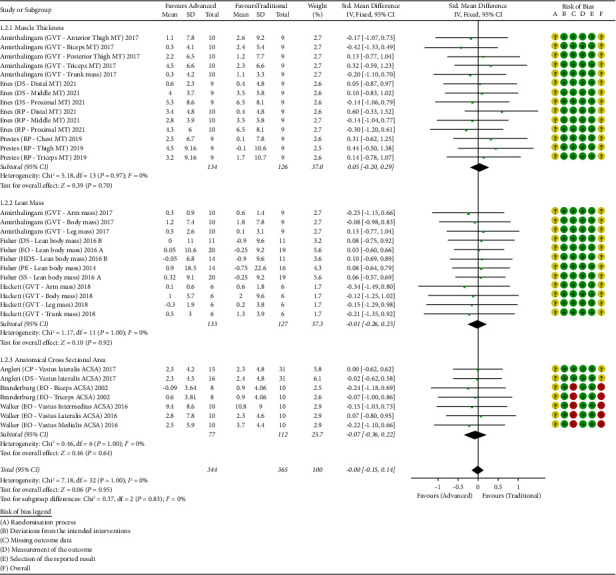
Figure 2.

Forest plot of the analyses and risk of bias. SD: standardized deviation; GTV: German volume training; MT: muscle thickness; DS: drop-set; RP: rest-pause; EO: eccentric overload; HDS: heavy DS; PE: pre-exhaustion; SS: super slow; ACSA: anatomical cross-sectional area; CP: crescent pyramid; risk of bias legend: A, randomization process; B, deviations from the intended interventions; C, missing outcome data; D, measurement of the outcome; E, selection of the reported result; F, overall risk of bias.
