Figure 2.

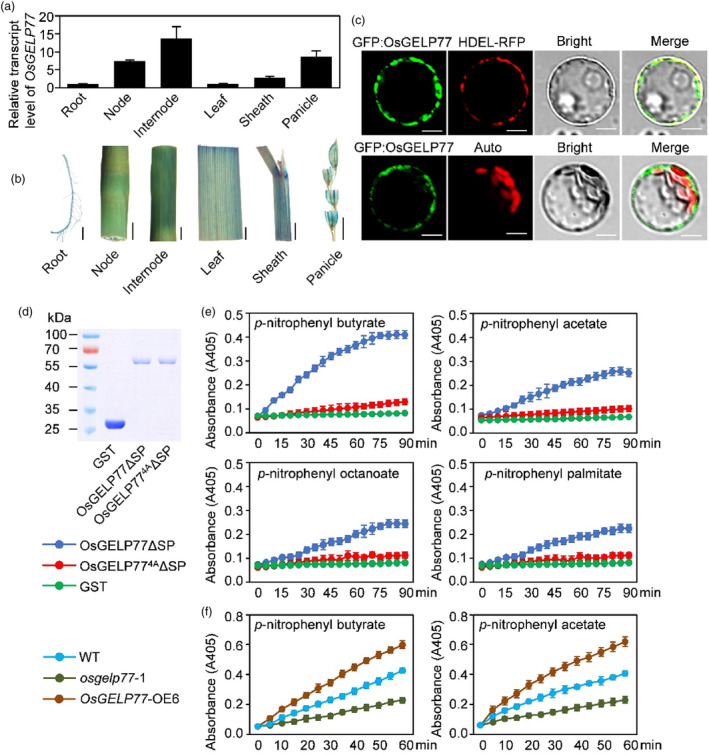
Expression patterns of OsGELP77 and lipase activity of OsGELP77. (a) OsGELP77 expression in different tissues. Data represent means ± SD (n = 3). Gene expression analysis was performed by RT‐qPCR and normalized to Actin. (b) Histochemical staining of different tissues of OsGELP77pro:Gus transgenic lines. Scale bars: 1 cm. (c) Subcellular localization of OsGLEP77 in rice protoplasts. HDEL protein fused to RFP was used as an endoplasmic reticulum marker. Auto, chlorophyll autofluorescence. Scale bars: 10 μm. (d) Expression and purification of recombinant OsGELP77ΔSP‐GST and OsGELP774AΔSP‐GST proteins in E. coli. (e) Recombinant OsGELP77ΔSP‐GST and OsGELP774AΔSP‐GST proteins were incubated with p‐nitrophenyl butyrate, p‐nitrophenyl acetate, p‐nitrophenyl octanoate, or p‐nitrophenyl palmitate. The absorbance readings were collected every 5 min in a time course of 90 min. (f) Total proteins from the leaves of transgenic plants and wild type (WT) were incubated with p‐nitrophenyl butyrate and p‐nitrophenyl acetate. The absorbance readings were collected every 5 min in a time course of 60 min. Data represent means ± SD. n = 6 (e, f).
