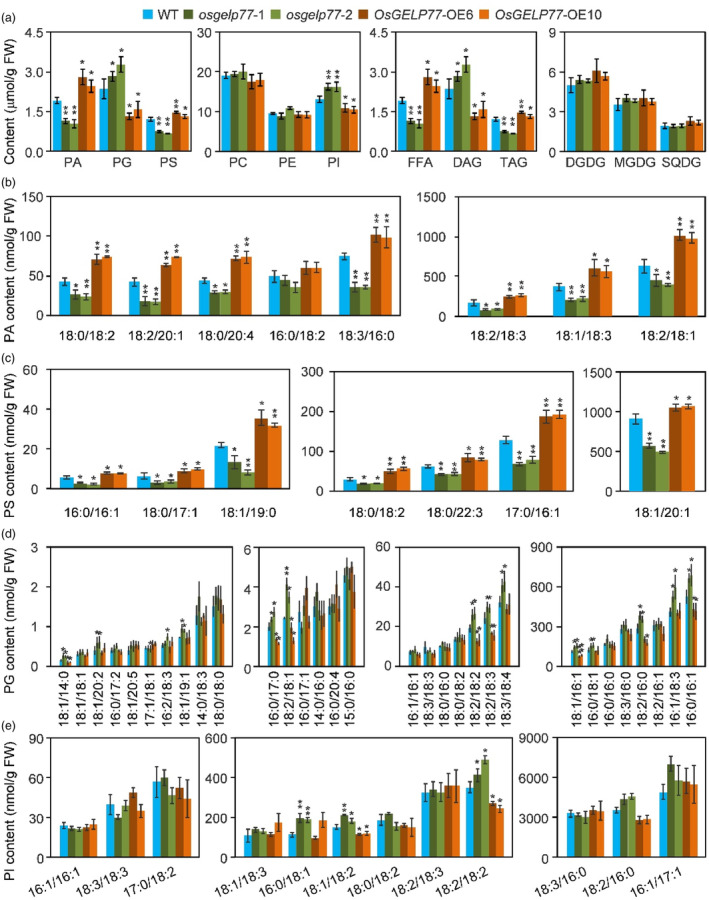
Figure 3.

Lipidomic profiling of the OsGELP77‐OE plants and osgelp77 mutants. (a) Total lipid composition in the leaves of transgenic plants and wild type (WT). (b) Contents of eight PA species. (c) Contents of seven PS species. (d) Contents of 31 PG species. (e) Contents of 12 PI species. The individual lipid species is presented as the XX:Y nomenclature where XX is the number of carbon atoms and Y is the number of double bonds in the fatty acyl groups. Data represent means ± SD (n = 3). Asterisks in (a–e) indicate significant differences between WT and the OsGELP77‐OE plants or osgelp77 mutants determined by two‐tailed Student's t‐test at **P < 0.01 or *P < 0.05.
