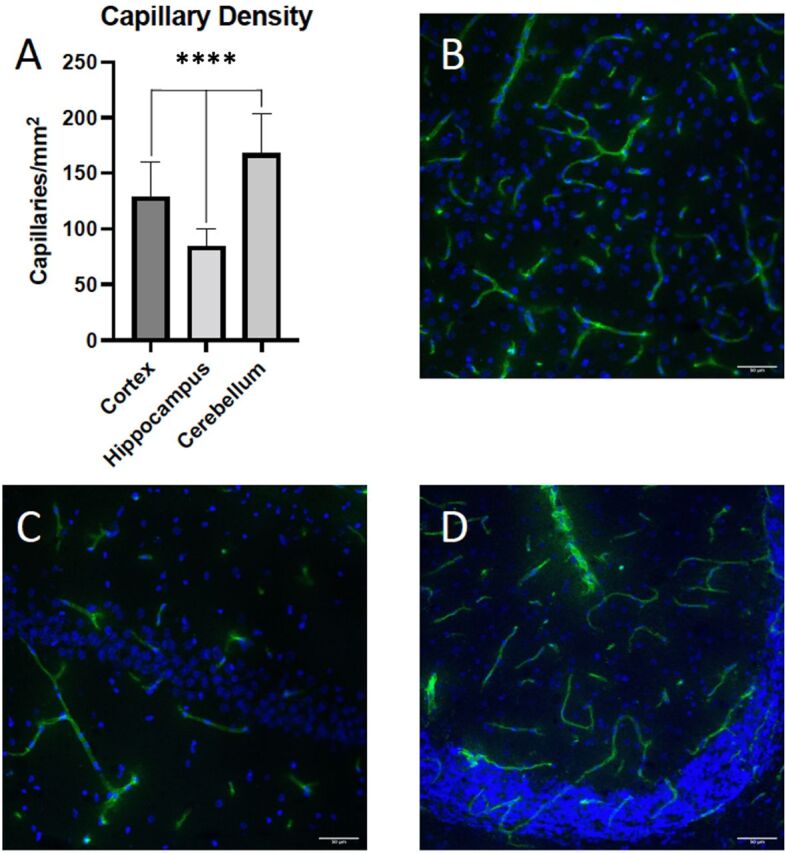
Fig. 4.

Brain vascular density in cerebral cortex, hippocampus, and cerebellum. Ten randomly chosen regions in the cortex, hippocampus, and cerebellum from four different rats (n = 40) were imaged and the number of RECA-1 positive capillaries were quantified (A). Representative images of the cortex (B), hippocampus (C), and cerebellum (D) showing RECA-1 immunofluorescence in green and 4′,6-diamidino-2-phenylindole (DAPI) in blue. Results are expressed as mean ± S.D. of 10 vessels per brain region. Asterisks indicate data points that were significantly different from control animals (****P < 0.0001).
