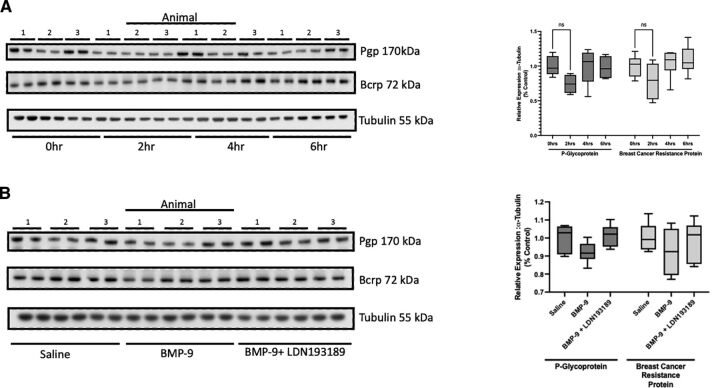
Fig. 9.
P-gp and Bcrp expression in rat brain microvessels is not altered in response to BMP-9 treatment. (A) Animals were administered a single dose of BMP-9 4(1.0 μg/ml). After 2 hours, 4 hours, or 6 hours, animals were euthanized and brain microvessels isolated and prepared for western blot analysis. Isolated microvessels (10 μg) were resolved on a 10% or 4%–12% SDS-polyacrylamide gel, transferred to a polyvinylidene difluoride membrane, and analyzed for expression of P-gp, Bcrp, or tubulin (i.e., the loading control). Each lane pair on the depicted western blot corresponds to a microvessel sample obtained from a single experimental animal. Relative levels of P-gp and Bcrp protein expression were determined by densitometric analysis and normalized to tubulin. Results are expressed as mean ± S.D. from at least two independent experiments, where each treatment group consisted of normalized data from six individual animals (n = 6). Asterisks represent data points that were significantly different from control (**p < 0.01). (B) Animals were administered a single dose of BMP-9 (1.0 μg/ml) or LDN193189 (10 mg/kg) at 1 hour prior to receiving a single dose of BMP-9 (1.0 μg/ml). After 6 hours, animals were euthanized and brain microvessels isolated and prepared for western blot analysis. Isolated microvessels (10 μg) were resolved on a 10% or 4%–12% SDS-polyacrylamide gel, transferred to a polyvinylidene difluoride membrane and analyzed for expression of P-gp, Bcrp, or tubulin (i.e., the loading control). Each lane pair on the depicted western blot corresponds to a microvessel sample obtained from a single experimental animal. Relative levels of P-gp and Bcrp protein expression were determined by densitometric analysis and normalized to tubulin. Results are expressed as mean ± S.D. from at least two independent experiments, where each treatment group consisted of normalized data from six individual animals (n = 6). Asterisks represent data points that were significantly different from control (**p < 0.01).

