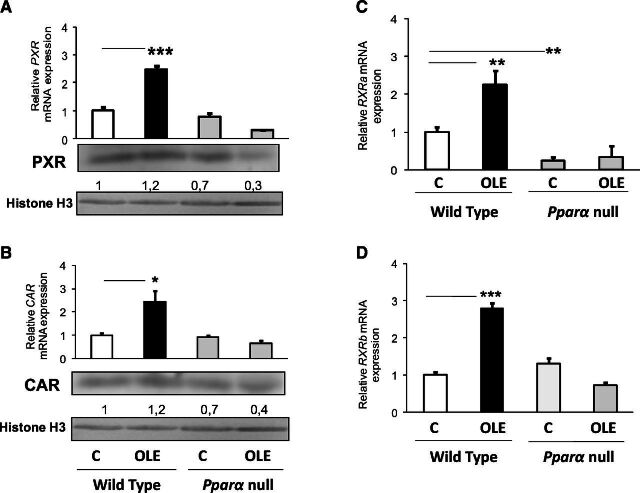
Fig. 5.
Assessment of the effect of OLE, a PPARα agonist, on various factors involved in CYP3A and CYP2C regulation (Konstandi et al., 2006). Pxr (A), Car (B), Rxra (C), and Rxrb (D) relative mRNA expression with quantitative PCR analysis. In wild-type and Ppara-null mice, comparisons were made between controls (designated C) and OLE-treated mice. Values are expressed as means ± S.E. Wild-type mice (n = 11); Pparα-null mice (n = 10). *P < 0.05; **P < 0.01; ***P < 0.001. Numbers below bands in Western blot captures show the ratio of the density of the sample band to that of histone H3.

