
Fig. 6.
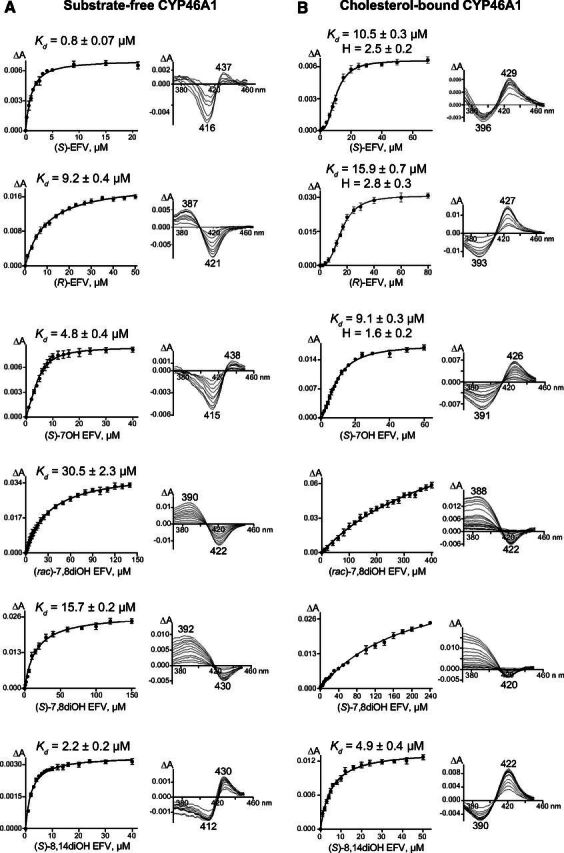
Spectral titrations of substrate-free CYP46A1 (A) and cholesterol-bound CYP46A1 (B) by EFV and some of its metabolites. Fit of spectral changes (ΔA, the amplitude of spectral response in the CYP46A1 difference spectrum) either to a hyperbolic equation or to the Hill equation, when cooperative binding was observed, is shown on the left, and the spectral response type in the CYP46A1 difference spectrum is shown on the right. The results are the mean ±S.D. of the measurements from the three independent titrations. Data for (S)-EFV are taken from (Mast et al., 2020).