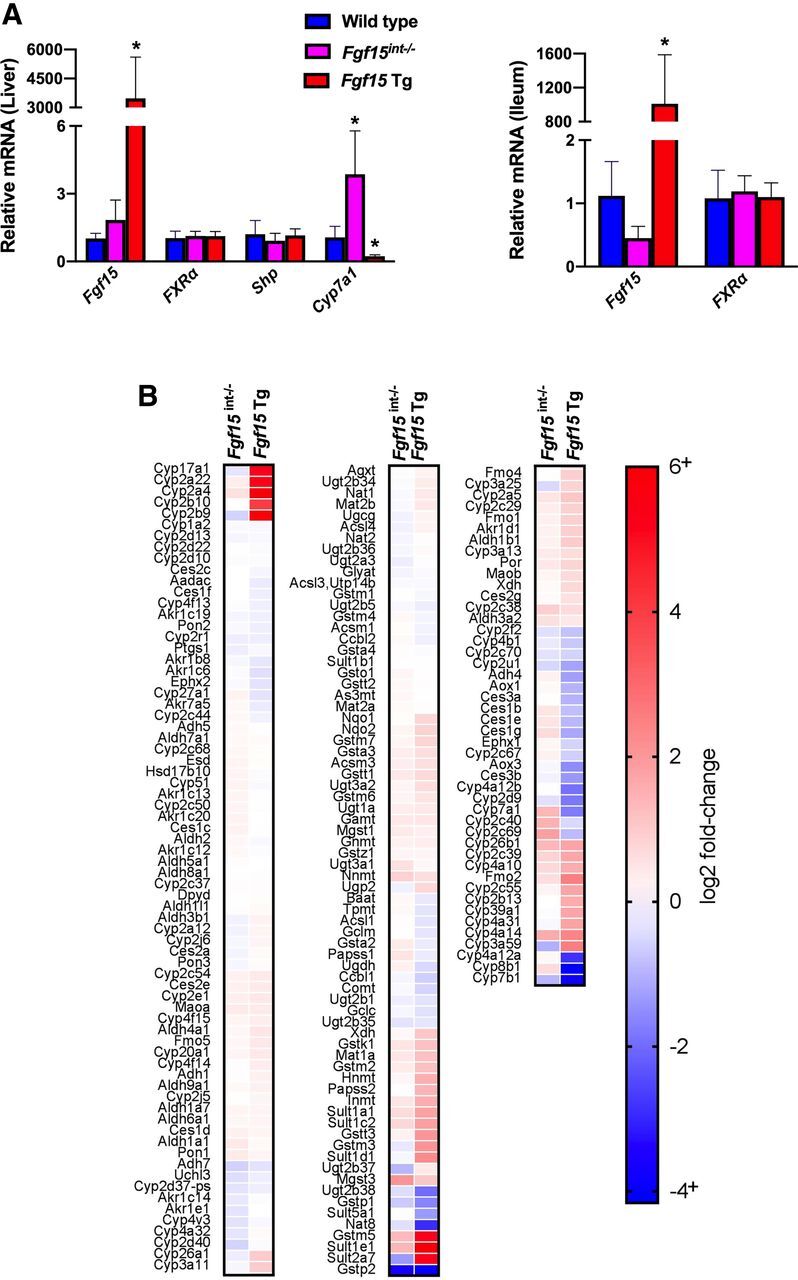
Fig. 1.

Relative hepatic and ileal mRNA values of Fgf15-related genes and RNA-seq analysis. (A) Hepatic and ileal gene expression was normalized to β-actin mRNA expression and graphs depict relative mRNA ± 1 S.D. (n: WT = 9, Fgf15int−/− = 6, Fgf15 Tg = 5; one-way ANOVA, Tukey post hoc). An asterisk denotes a significant difference from WT (P < 0.05). (B) Heat map illustrates logtwofold-change in RNAseq analysis as compared with WT (n = 3/group).
