Fig. 2.
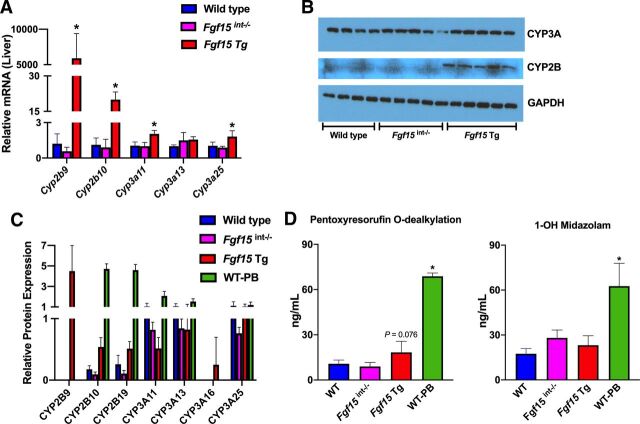
Relative hepatic mRNA, protein, and function of cytochrome P450s. (A) Relative hepatic mRNA expression normalized to β-actin mRNA expression (n: WT = 5, Fgf15int−/− = 6, Fgf15 Tg = 5; one-way ANOVA, Tukey post hoc). Graphs depict relative mRNA ± 1 S.D. An asterisk denotes a significant difference from WT (P < 0.05). Cyp2b9 and Cyp2b10 failed Levene’s test, therefore Kruskal-Wallis was used for analysis. (B) Western blot of CYP3A and CYP2B using 20μg of liver homogenate (n: WT = 4, Fgf15int−/− = 5, Fgf15 Tg = 5; one-way ANOVA, Tukey post hoc). (C) Liquid chromatograhy-mass spectrometry analysis of relative protein expression of CYP2B and CYP3A isoforms (n: WT = 5, Fgf15int−/− = 5, Fgf15 Tg = 5, WT-PB = 3; one-way ANOVA, Tukey post hoc). (D) Measurements of pentoxyresorufin and midazolam metabolite formation to assess CYP2B and CYP3A activity in liver microsomes of WT, Fgf15int−/−, Fgf15 Tg, and phenobarbital-treated WT mice (n: WT = 5, Fgf15int−/− = 5, Fgf15 Tg = 5, WT-PB = 3; one-way ANOVA, Tukey post hoc).

