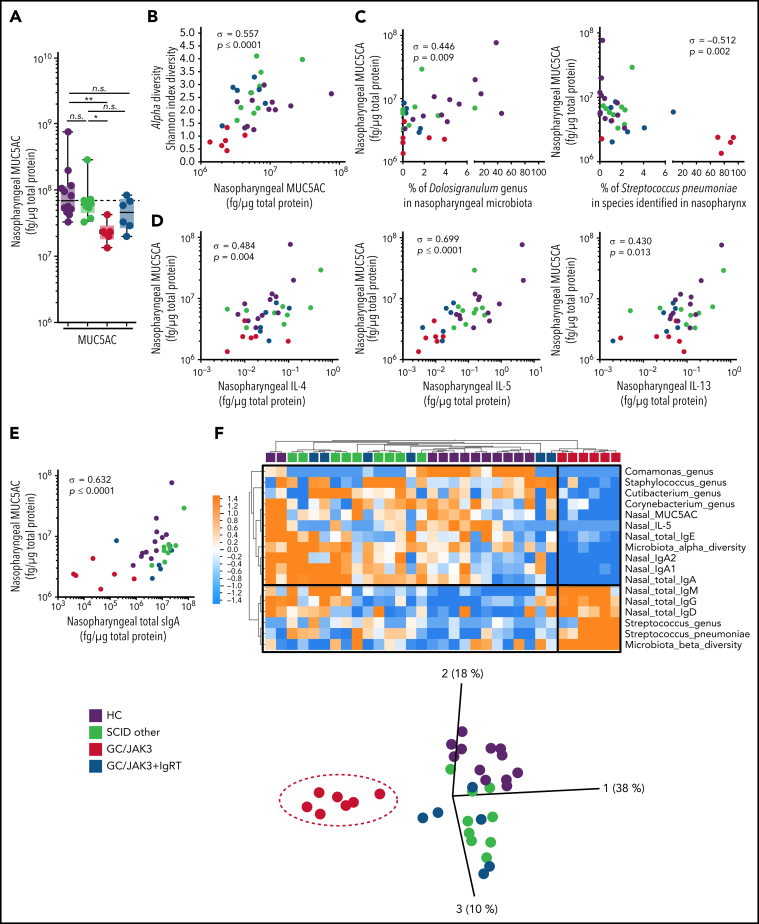
Figure 6.
Defective type 2 immunity underlies nasopharyngeal dysbiosis in HSCT-treated GC/JAK3 patients. (A) Nasopharyngeal MUC5AC concentration in HC and HSCT-treated SCID patients. (B) Individual correlation plot between nasopharyngeal MUC5AC concentration and α-diversity. (C) Individual correlation plot between nasopharyngeal MUC5AC concentration and Dolosigranulum genus abundance (%) or S pneumoniae abundance (%). (D) Individual correlation plot between nasopharyngeal MUC5AC concentration and nasopharyngeal IL-4, IL-5, and IL-13 concentration. (E) Individual correlation plot between nasopharyngeal MUC5AC concentration and nasopharyngeal secretory IgA (SIgA). (F) Heatmap representation of statistically different (P < .05) nasopharyngeal features between GC/JAK3 patients and the other patients and the three-dimensional principal coordinate analysis representation. Panel A: box plots with median ± minimum to maximum. P values were determined with the Kruskal Wallis test followed Dunn's posttest for multiple-group comparisons; *P < .05, **P < .005. In panels B through E, σ represents Spearman coefficient and p the P value. n.s., not significant.

