. 2024 Mar 13;15(15):5681–5693. doi: 10.1039/d4sc00595c

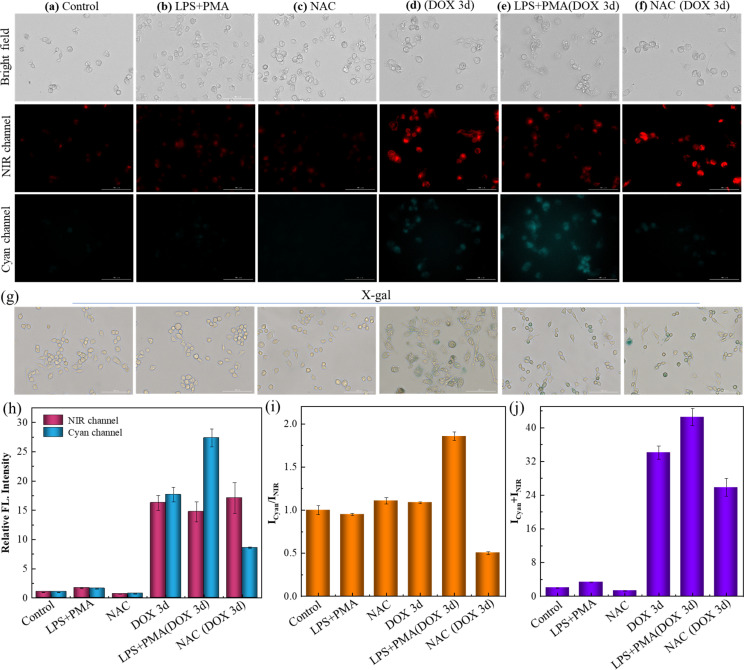
Fig. 3. (a–f) Fluorescent images of RAW 264.7 cells after incubation with 10 μM SA-HCy-1. (a) The control group (normal RAW 264.7 cells); (b) the cells were pretreated with LPS (1.0 μg mL−1) and PMA (0.5 μg mL−1) for 60 min; (c) the cells were pretreated with NAC (10 mM) for 60 min; (d) the cells were pretreated with DOX (0.1 μM) for 3 days; (e) the cells were pretreated with 0.1 μM DOX for 3 days and then treated with LPS (1.0 μg mL−1) and PMA (0.5 μg mL−1) for 60 min. (f) The cells were pretreated with 0.1 μM DOX for 3 days and then treated with NAC (10 mM) for 60 min. Top: bright field; middle: NIR channel: ground: cyan channel. For the NIR channel: λex = 628 nm, λem = 670–730 nm; for the cyan channel: λex = 377 nm, λem = 450–500 nm, scale bar = 100 μm. (g) X-gal staining of RAW 264.7 cells with different treatments of (a–f). (h) Relative fluorescence intensities of (a)–(f) from NIR (red bars) and cyan (blue bars) channels. (i) Quantification of fluorescence intensity ratios (Icyan/INIR) of the images from (a)–(f). (j) Quantification of fluorescence intensity sums (Icyan + INIR) of the images from (a) to (f). Error bars represent the standard deviation (±S.D.), n = 3.

Fig. 3