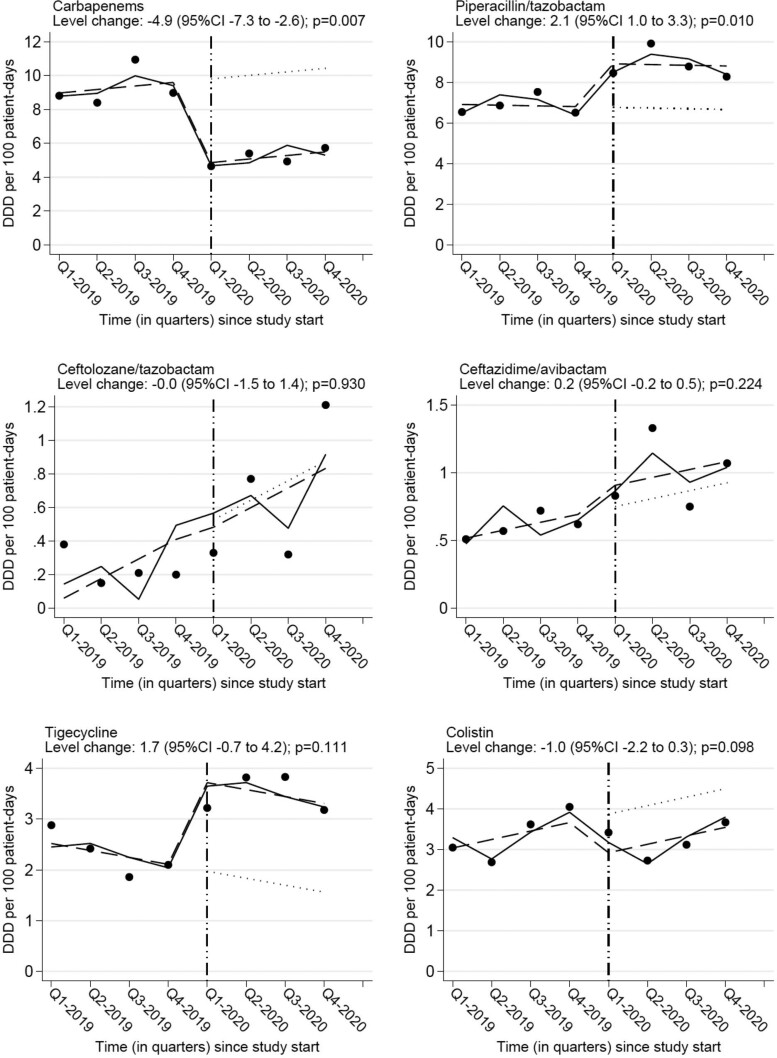
Figure 2.
Interrupted time series graphs showing level changes in the consumption of carbapenems and other selected antibiotics with activity against MDR-GNB following the ASP implementation. The dots correspond to quarterly antibiotic consumption rates measured in DDD per 100 PD. The solid line shows the predicted rates from a segmented linear regression model adjusted for seasonality and autocorrelation. The dashed line shows the deseasonalized trend. The dotted line corresponds to the counterfactual scenario assuming the intervention was not implemented.

