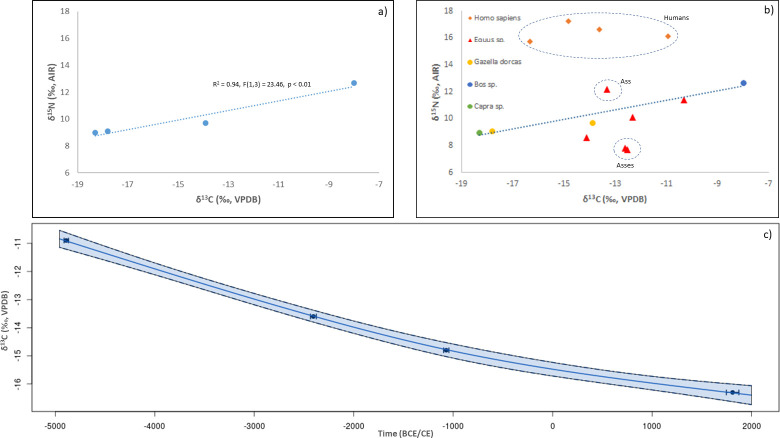
Fig 5. Results of the stable carbon (δ13C) and nitrogen (δ15N) isotope analyses.
(A) Correlation between δ13C and δ15N isotope ratios for tooth collagen from Umm Jirsan herbivores other than asses. (B) Biplot of δ13C and δ15N isotope ratios for bone and tooth collagen samples for humans and all herbivores from Umm Jirsan. Ellipses identify human group and groups of asses that do not follow the overall herbivore trend. (C) Bayesian plot of the relationship between chronology and human bone collagen δ13C values. The continuous line is the estimated mean while the band represent the 95% credible interval of the standard error of the mean. Calibrated human radiocarbon ages are summarized by the mean (points) and 95% credible intervals (whiskers).

