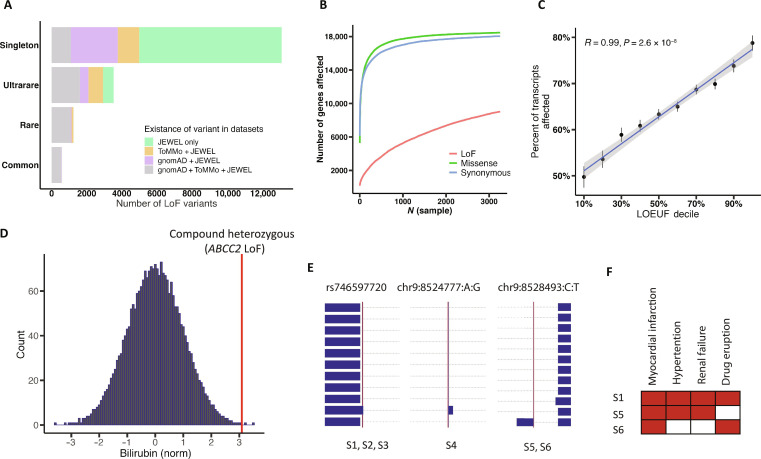
Fig. 2. LoF variants and human knockout in the JEWEL dataset.
(A) Number of known and unregistered LoF variants compared with gnomAD database (v2.1.1) and ToMMo (4.7K). Variants are categorized into four AF bins. Common: MAF > 1%; rare, MAF < 1% and MAF ≥ 0.01%; ultrarare: minor allele count > 1 and MAF < 0.01%; singleton. (B) Cumulative number of genes affected by LoF, missense, and synonymous variants. (C) The average percentage of transcripts affected by LoF variants, categorized by the genes’ LOEUF deciles. Genes that are highly intolerant to functional variation, as indicated by lower LOEUF deciles, have fewer affected transcripts compared to genes that are more tolerant. Error bars are included to indicate SEs. (D) The histogram of normalized total bilirubin levels among individuals in the JEWEL cohort. The red line highlights an individual with compound heterozygous LoF variants in the ABCC2 gene, ranking third in the whole JEWEL dataset. This elevated level of total bilirubin is consistent with the clinical phenotype of Dubin-Johnson syndrome, which is caused by the inactivation of the ABCC2 gene. (E) The plot presents data on six individuals carrying LoF variants in the PTPRD gene. The identifier for each LoF variant, either rsID or variant ID, is displayed at the top. Blue boxes represent exons for different transcripts, while the red lines mark the locations of these LoFs. Individual IDs carrying the LoF variants are indicated at the bottom. A zoomed-out perspective of the plot is presented in fig. S9. (F) The shared phenotypes among three PTPRD LoF carriers for whom comprehensive clinical data are available (S1, S5, and S6), with the names of the phenotypes provided for reference.

